Big Data LiDAR meets GIS
Overview   Features   Download & Order  

  Deutsch
KomVISH

Boost your GIS productivity

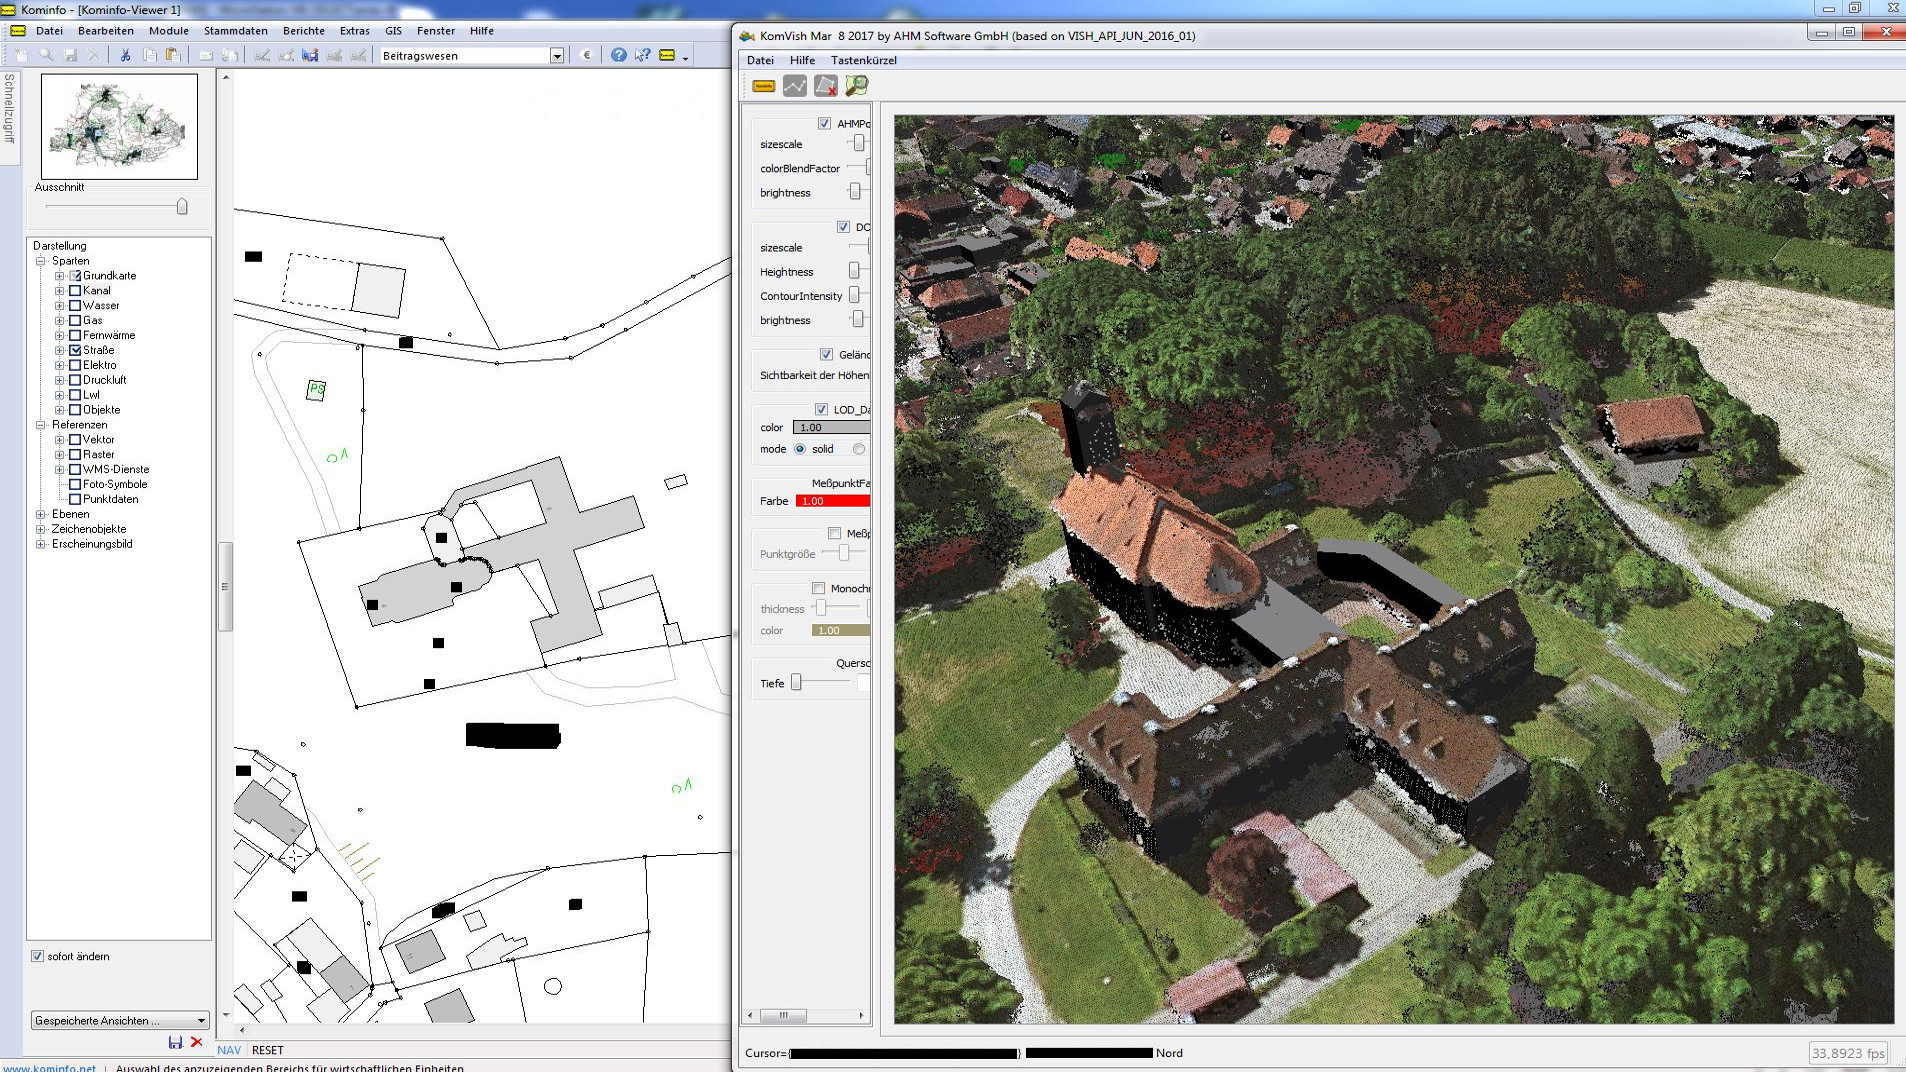
KomVISH is a stand-alone Software for real-time visualization of big data stemming from laser scanning. Simple interfaces allow quick data exchange from and to geographic information systems (GIS) for lines and polygons. Parts of the laser data can be cropped out and transferred or exported for further processing.


Supported GIS systems

Features


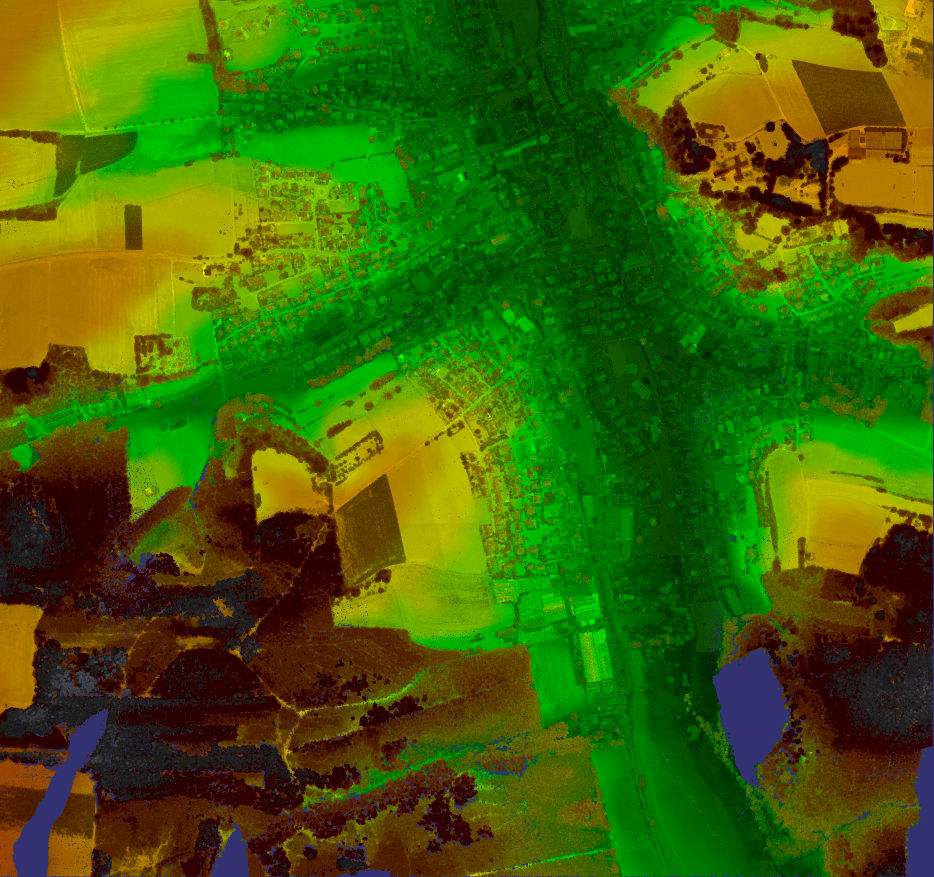
Visualization features reveal more details:

Digital Elevation Model

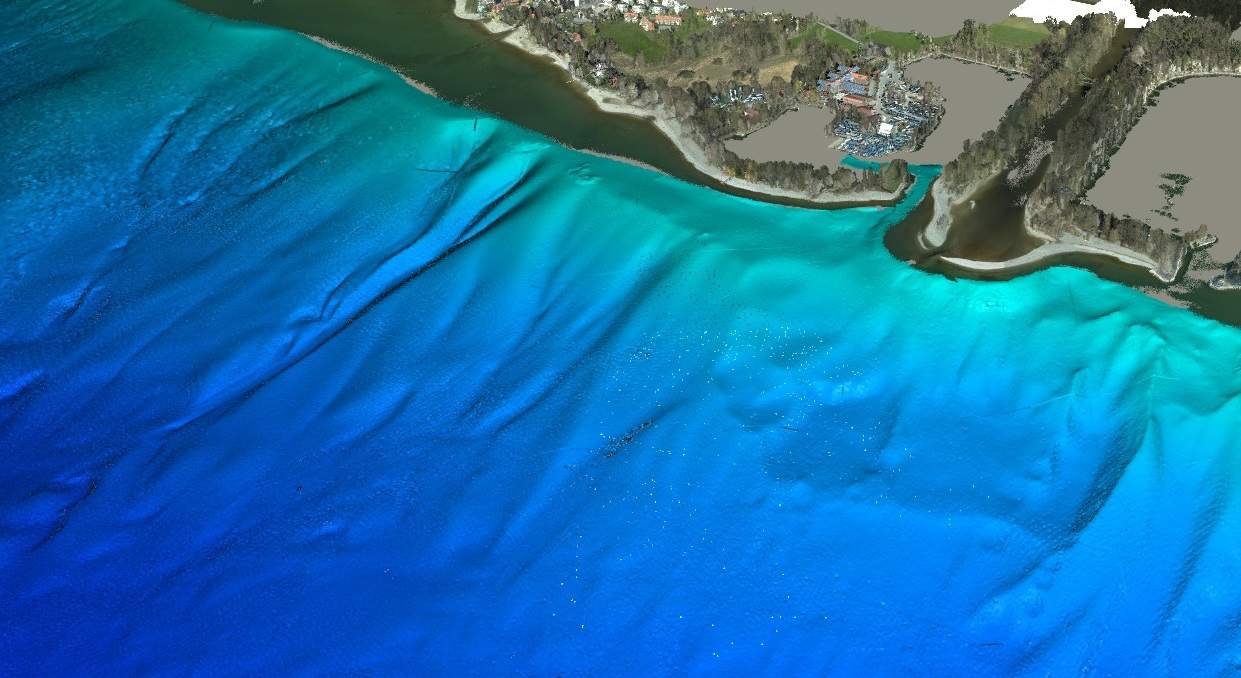
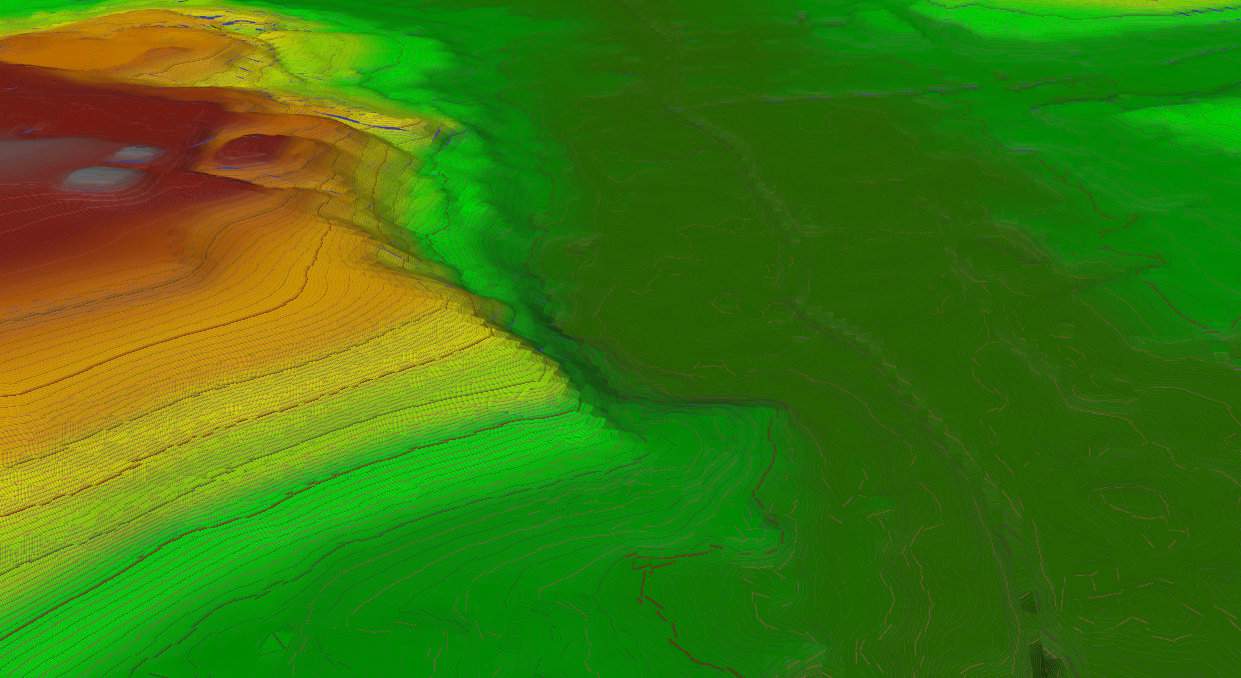
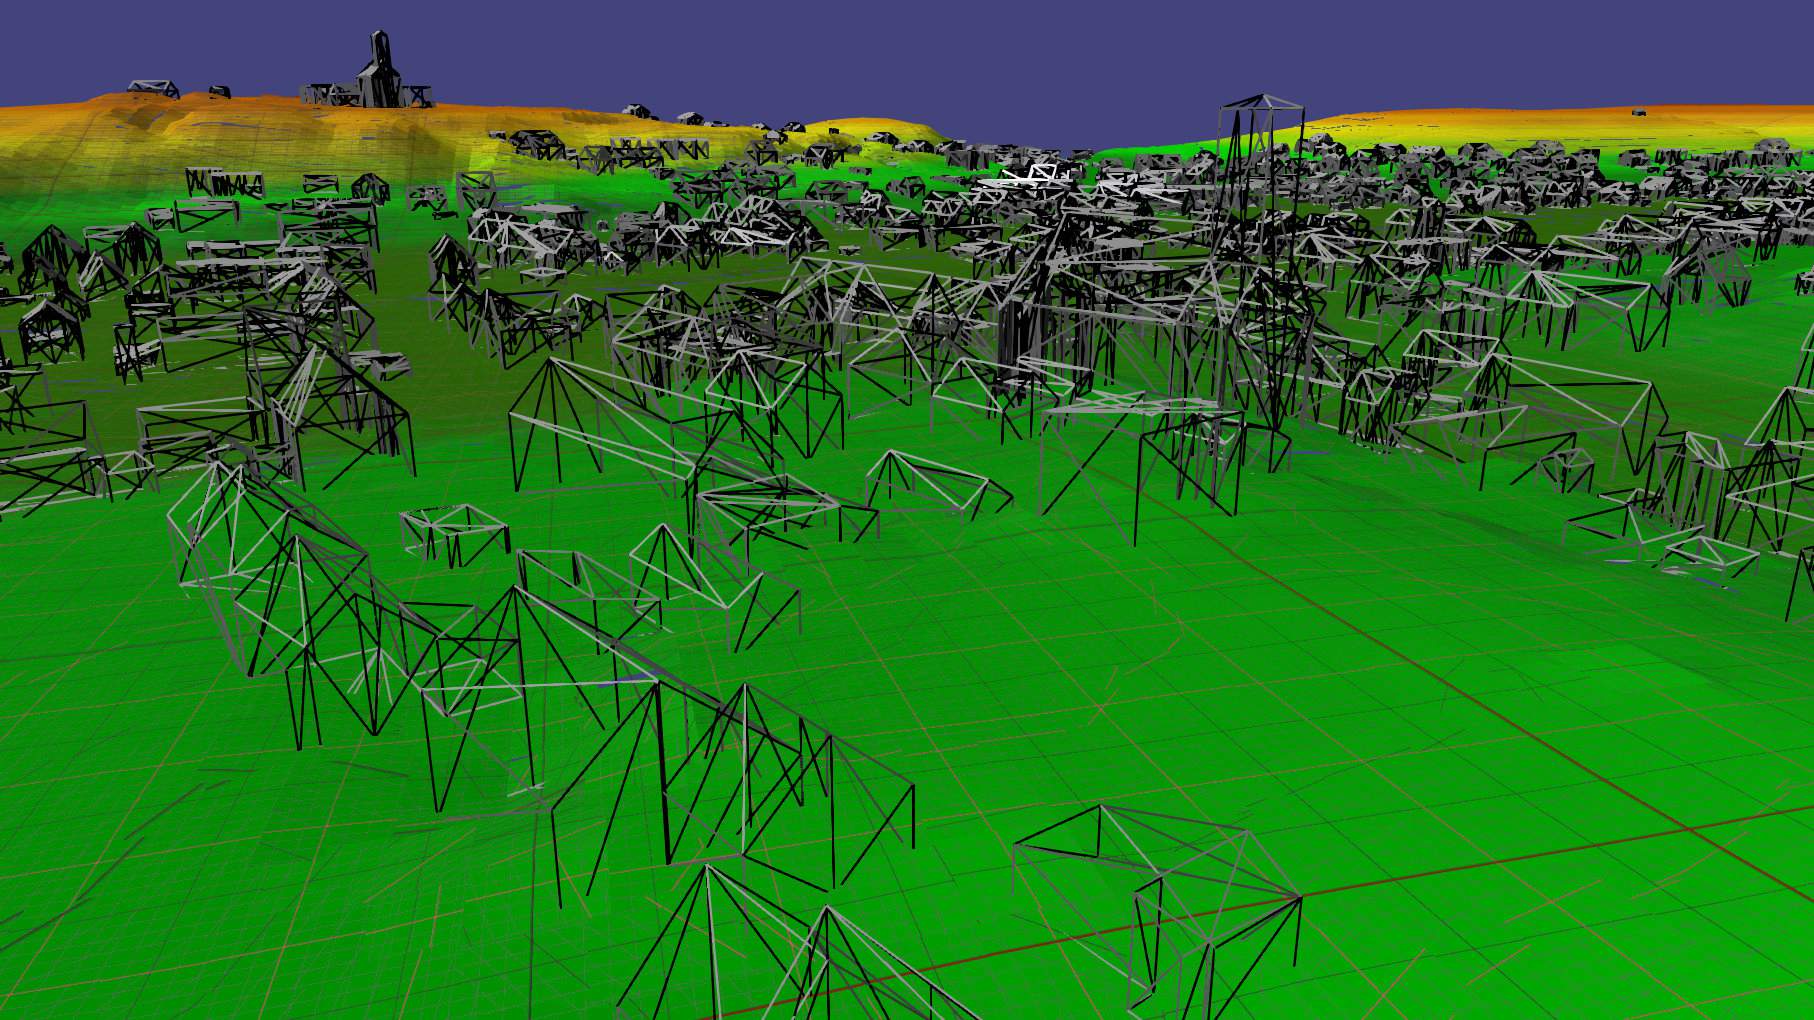
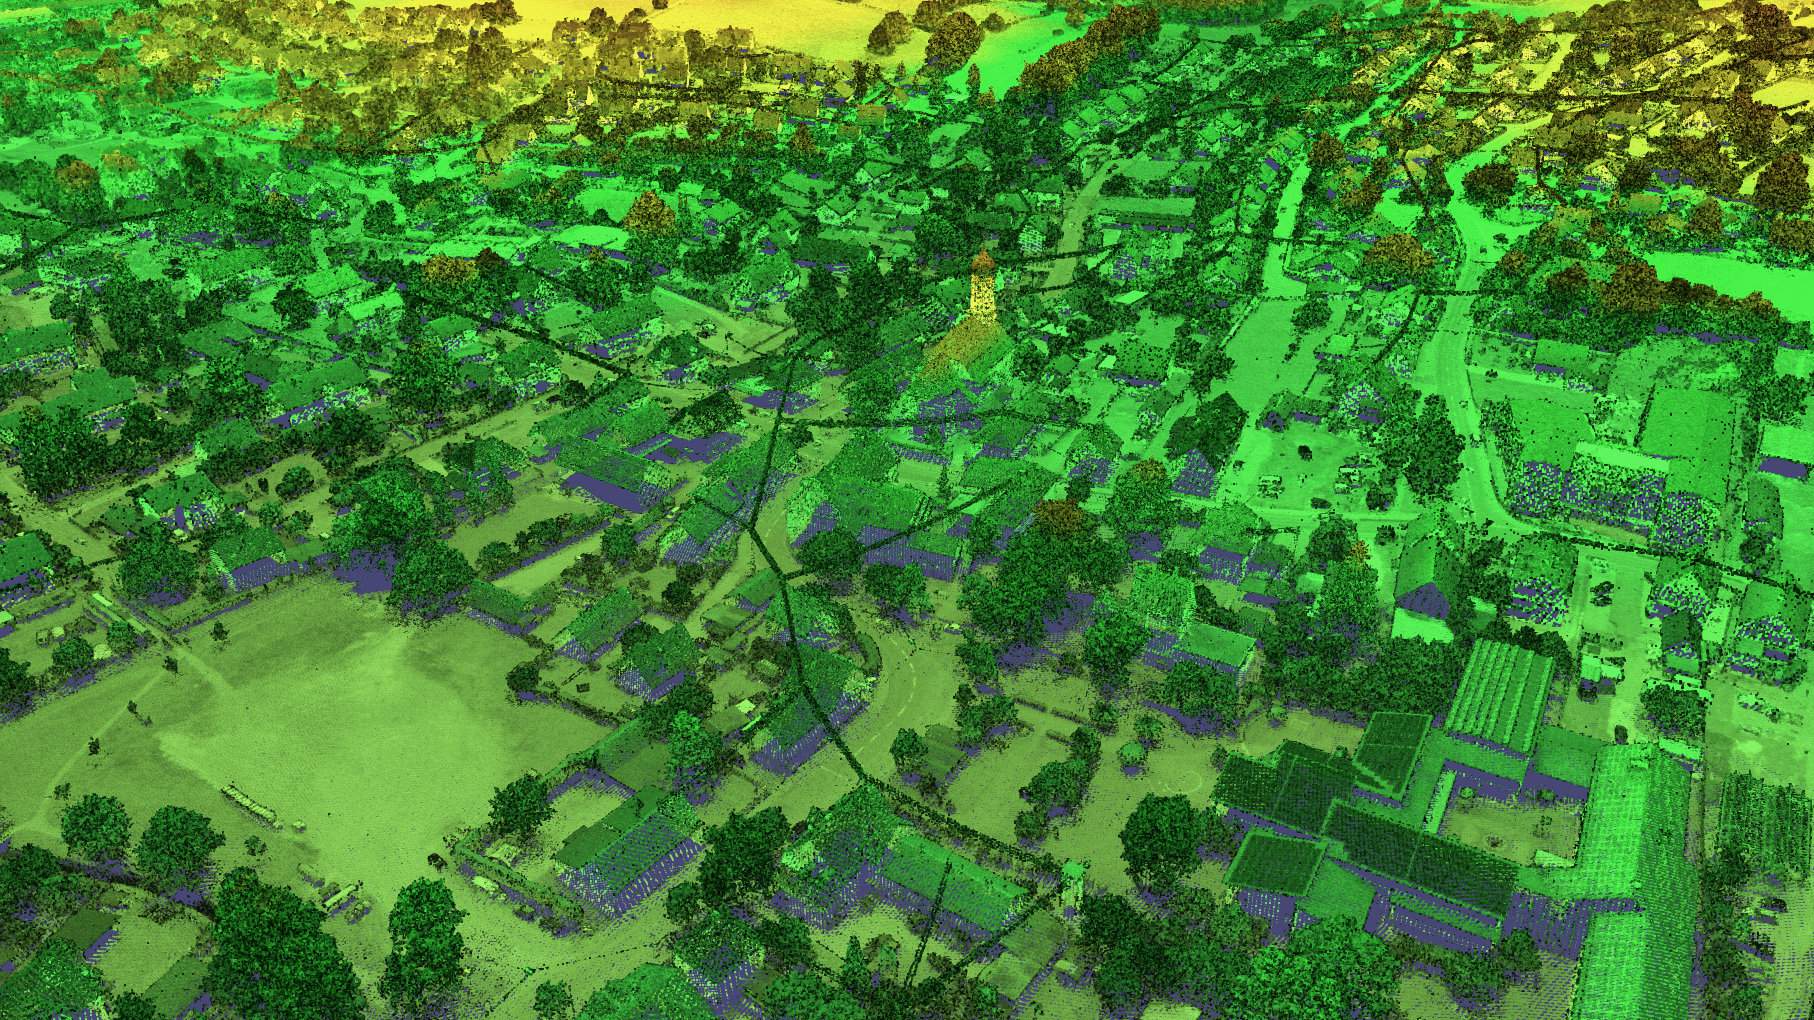
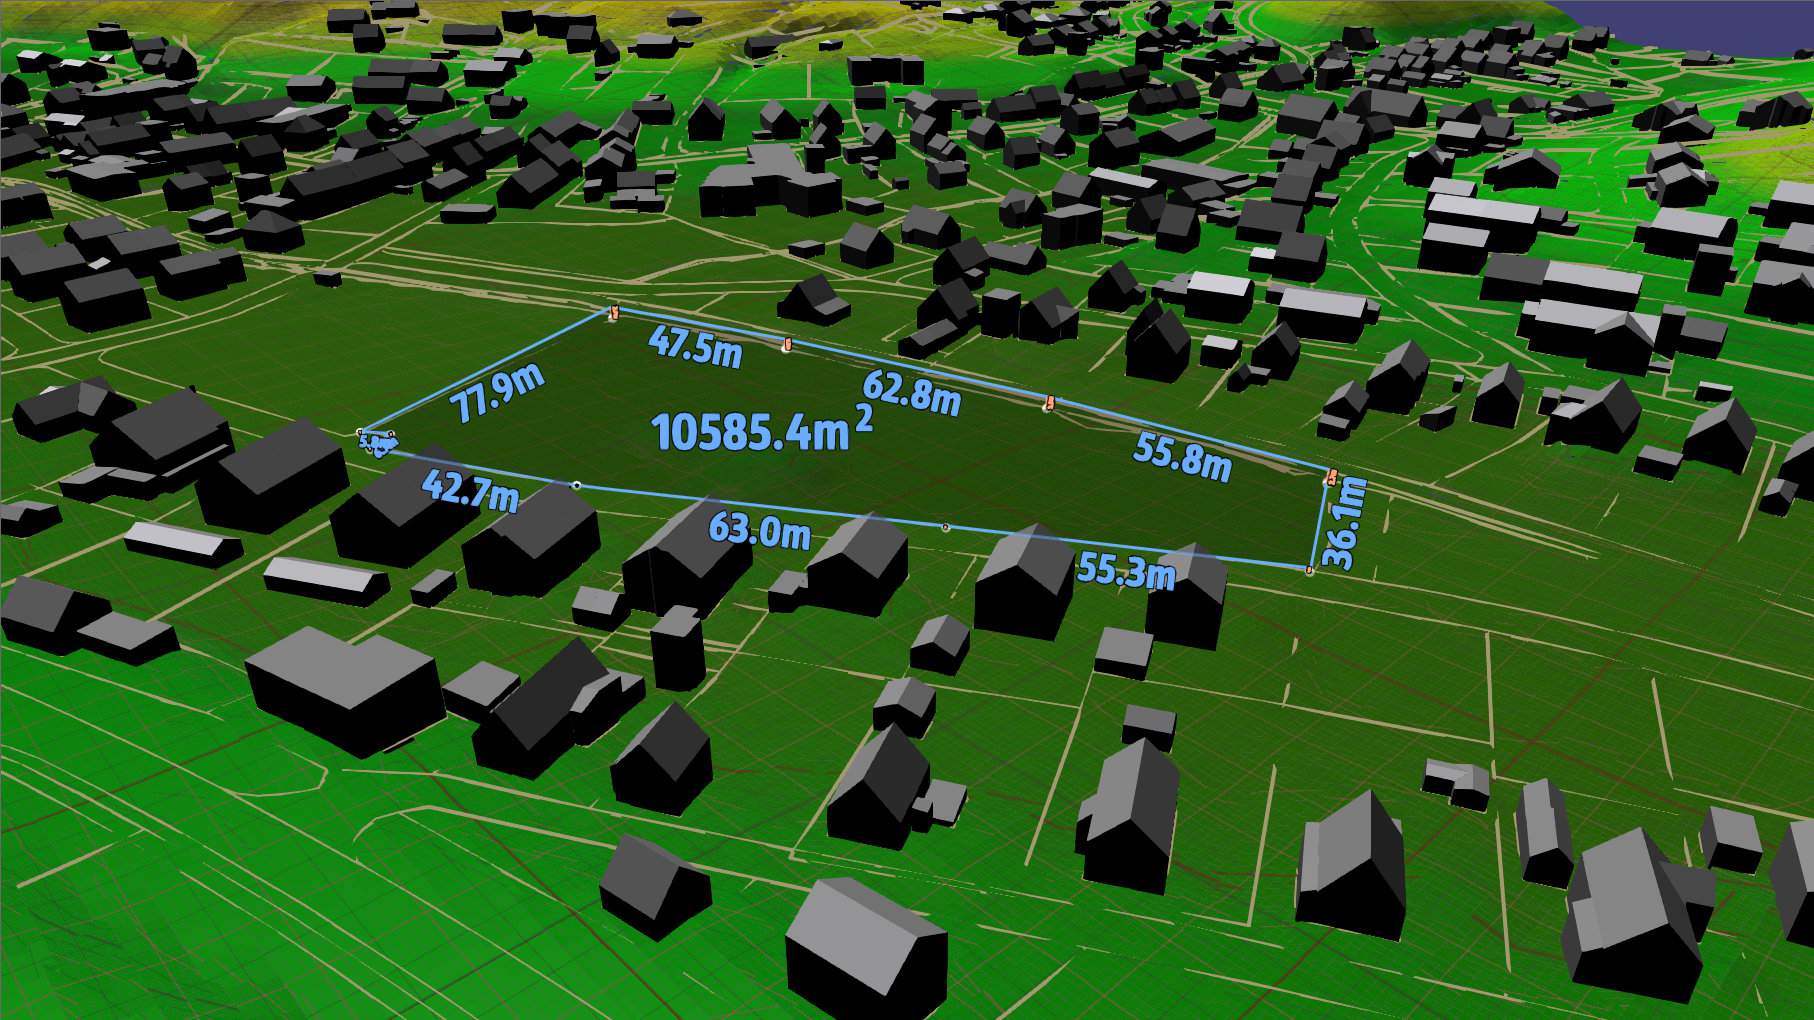
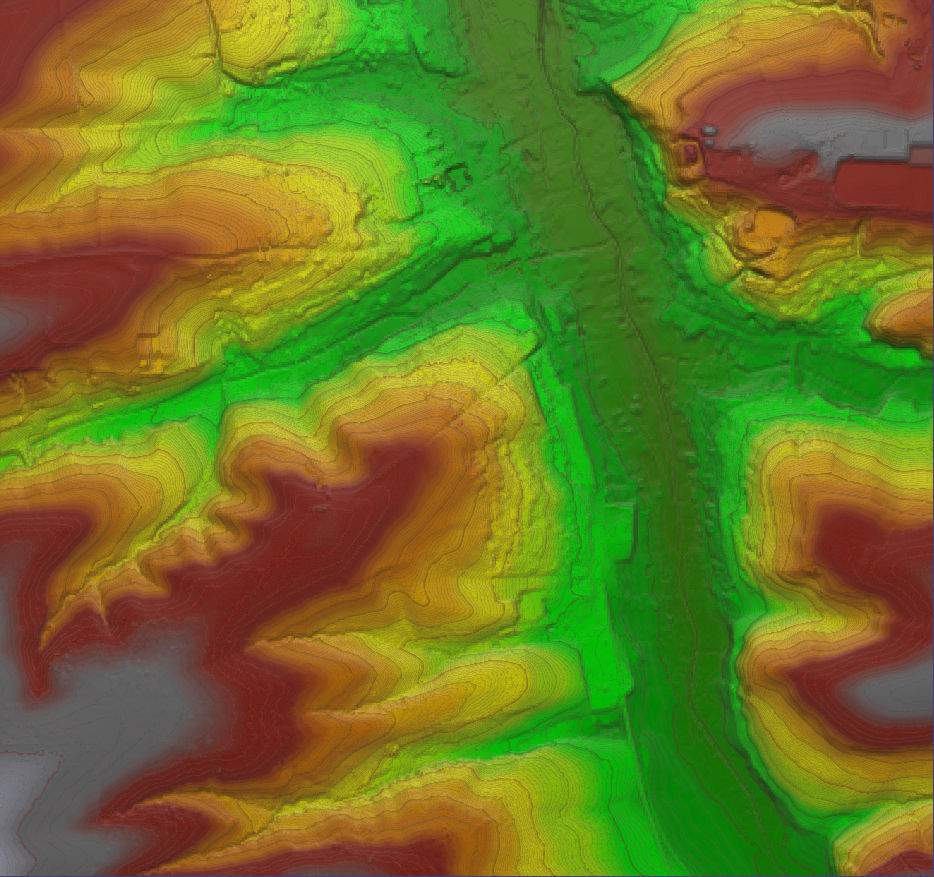
Shaded and colored surfaces enriched with color coded height lines.
Level-of-Detail Data

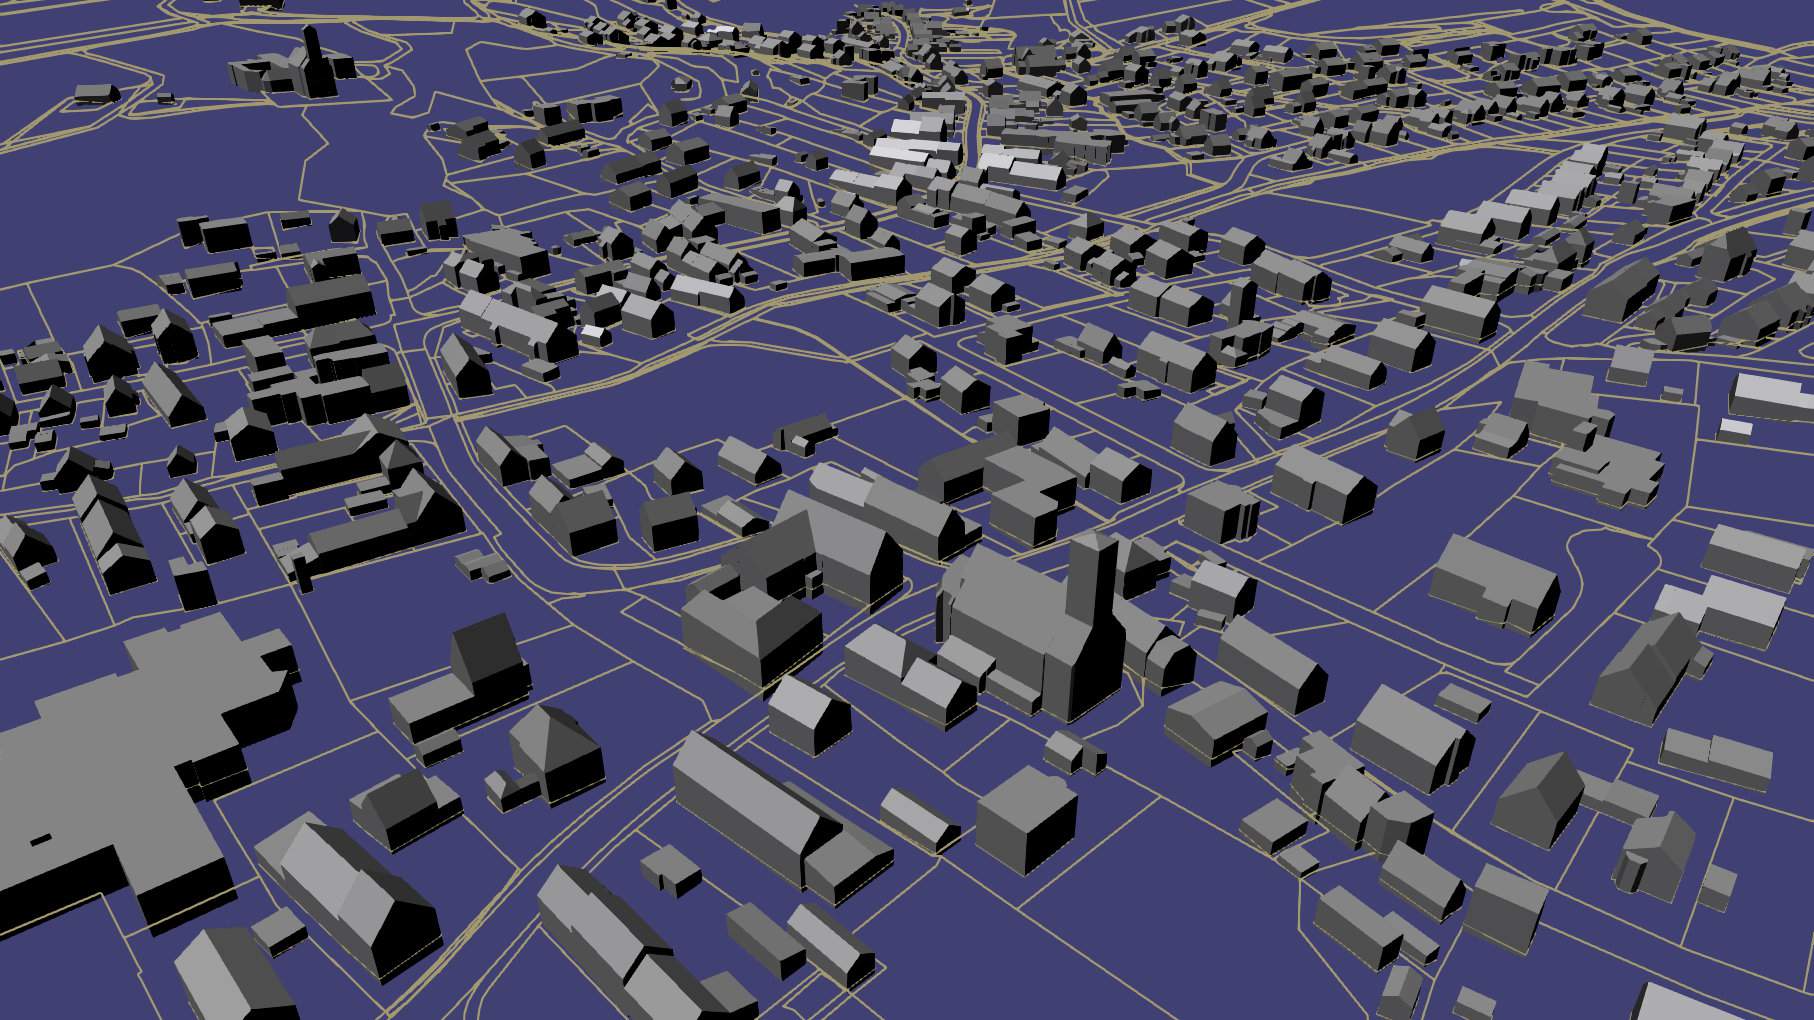
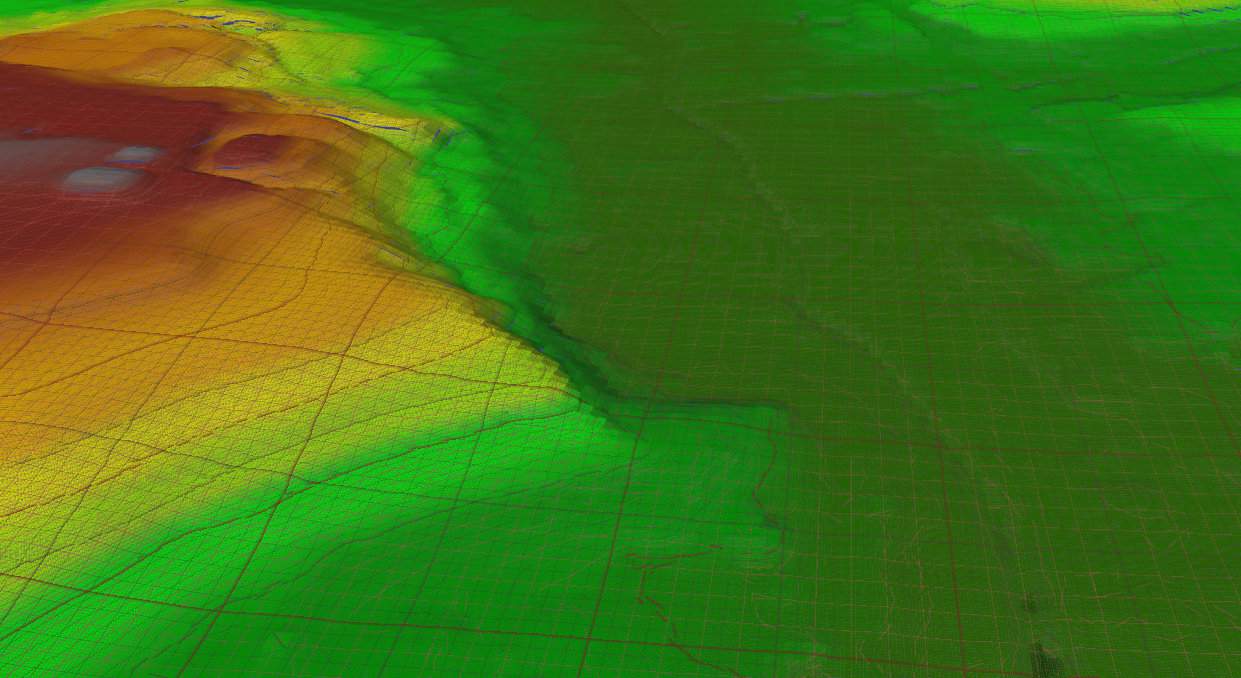
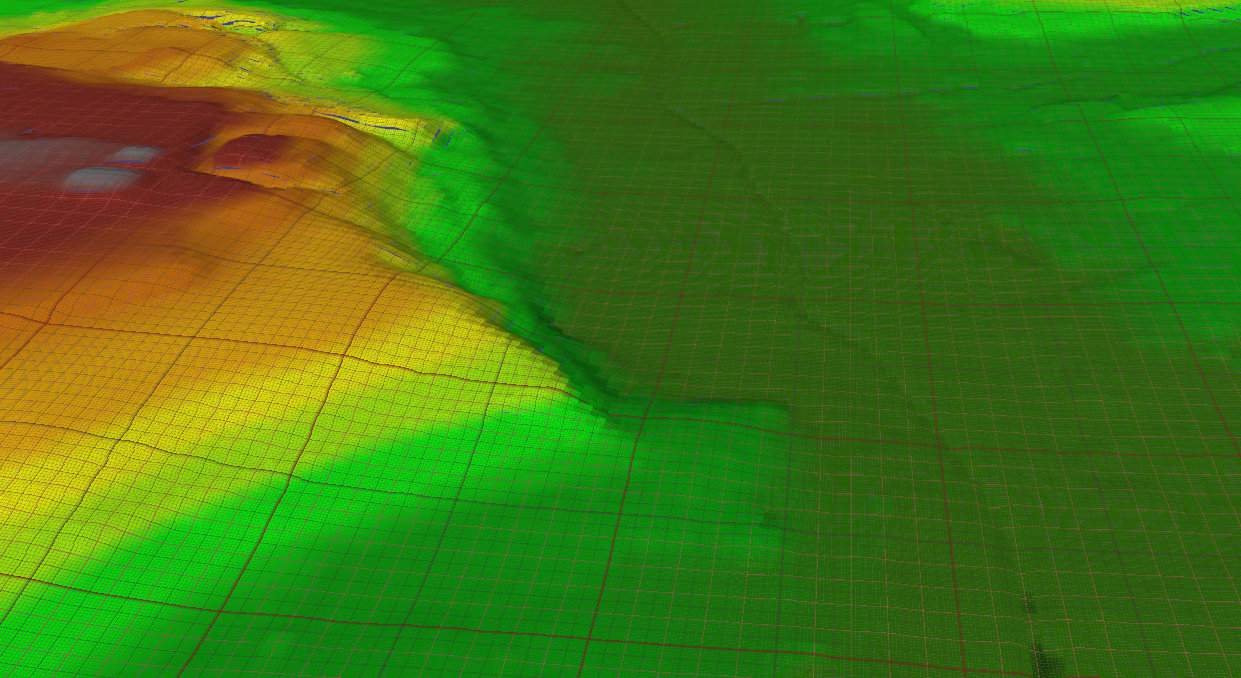
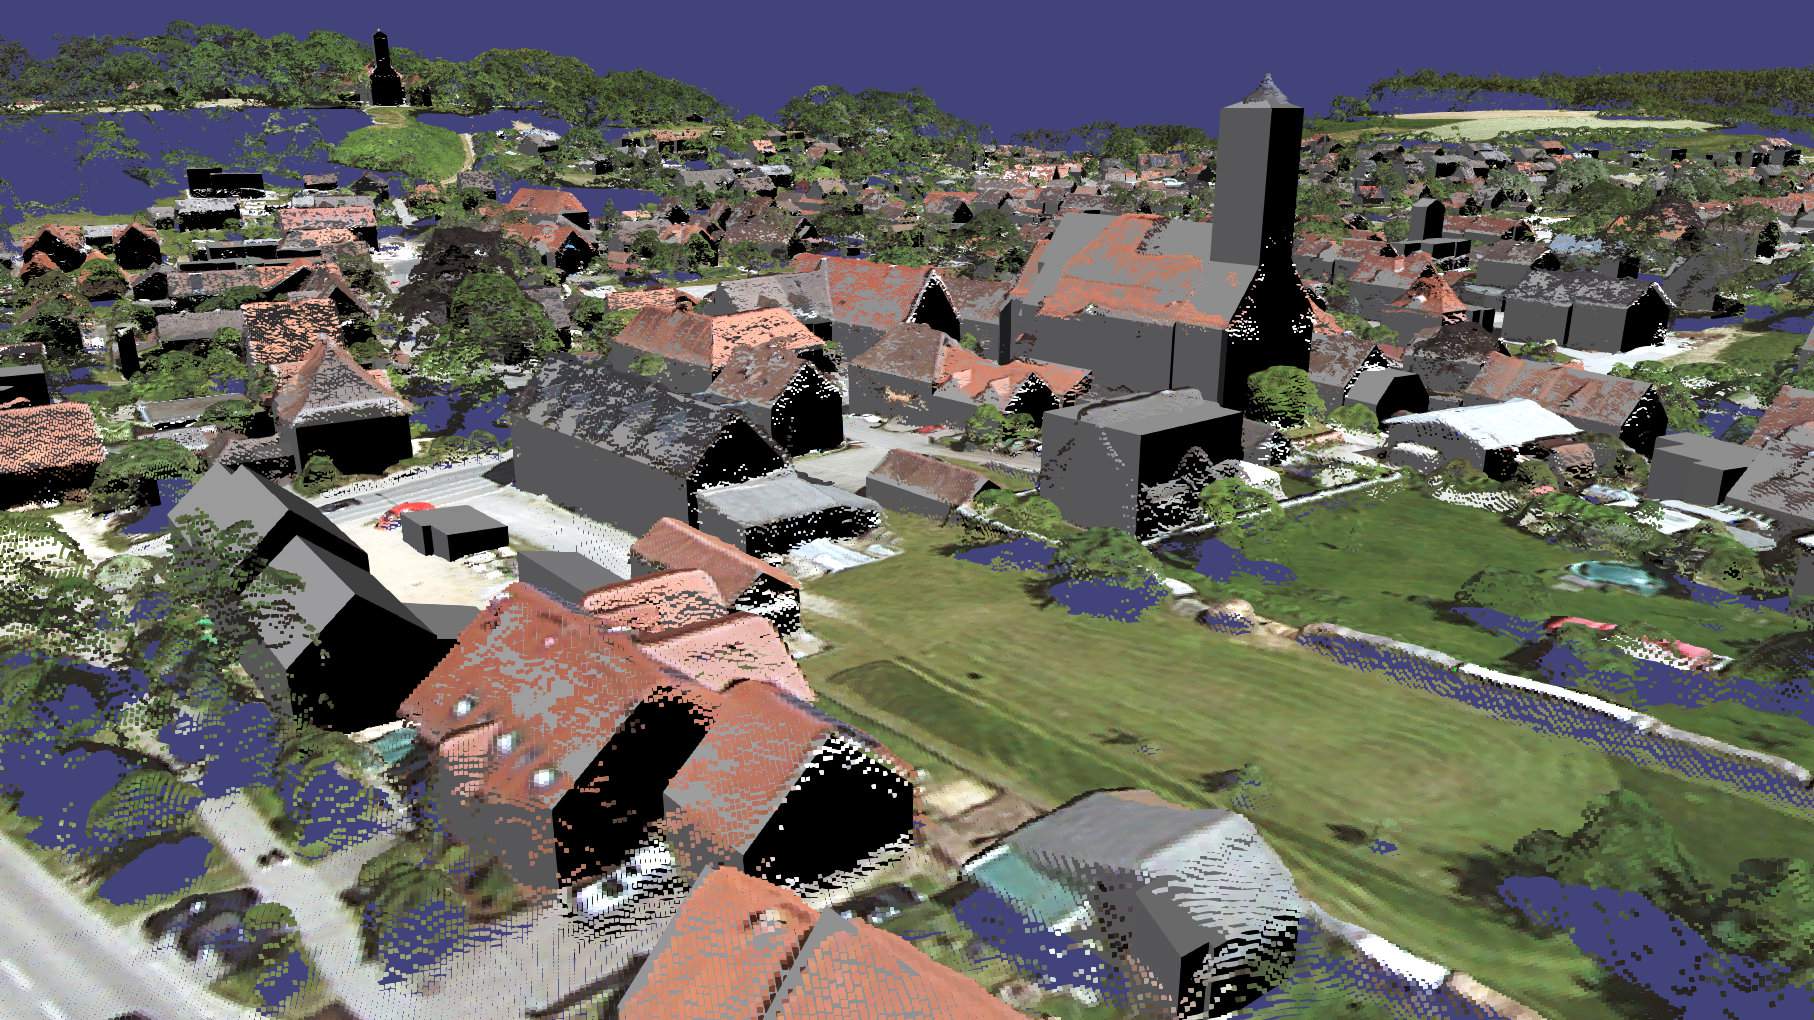
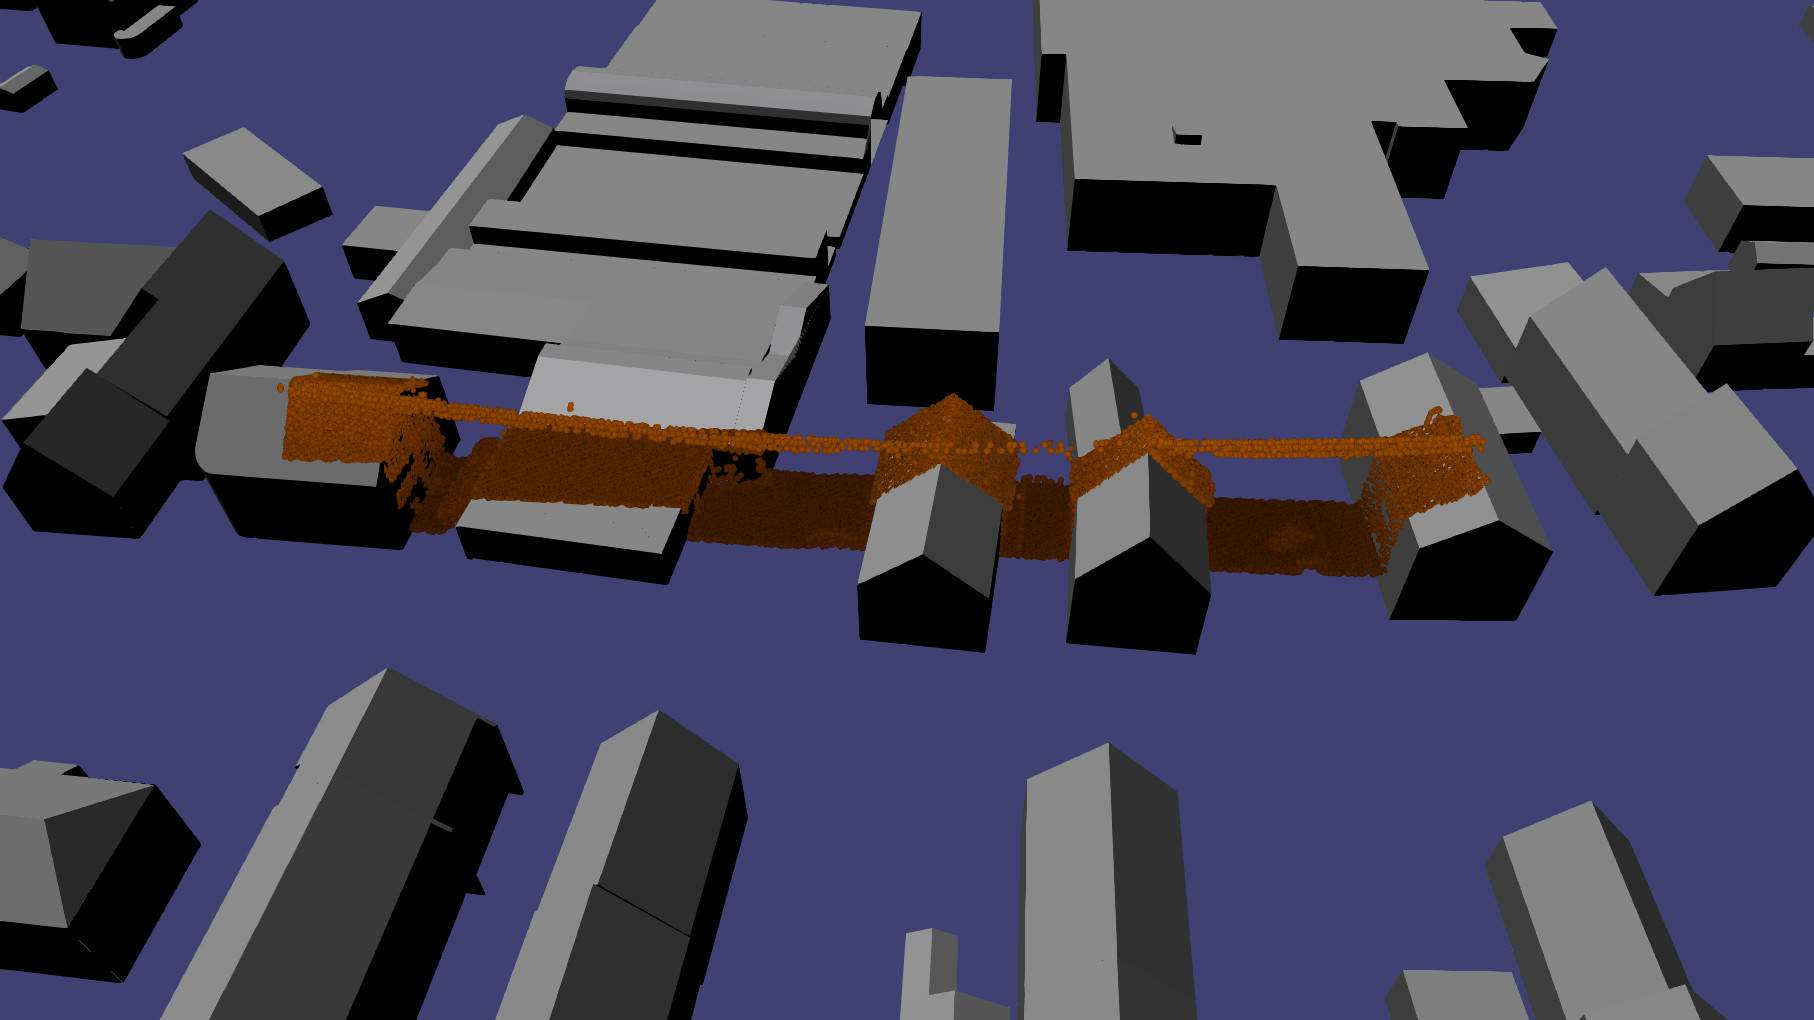
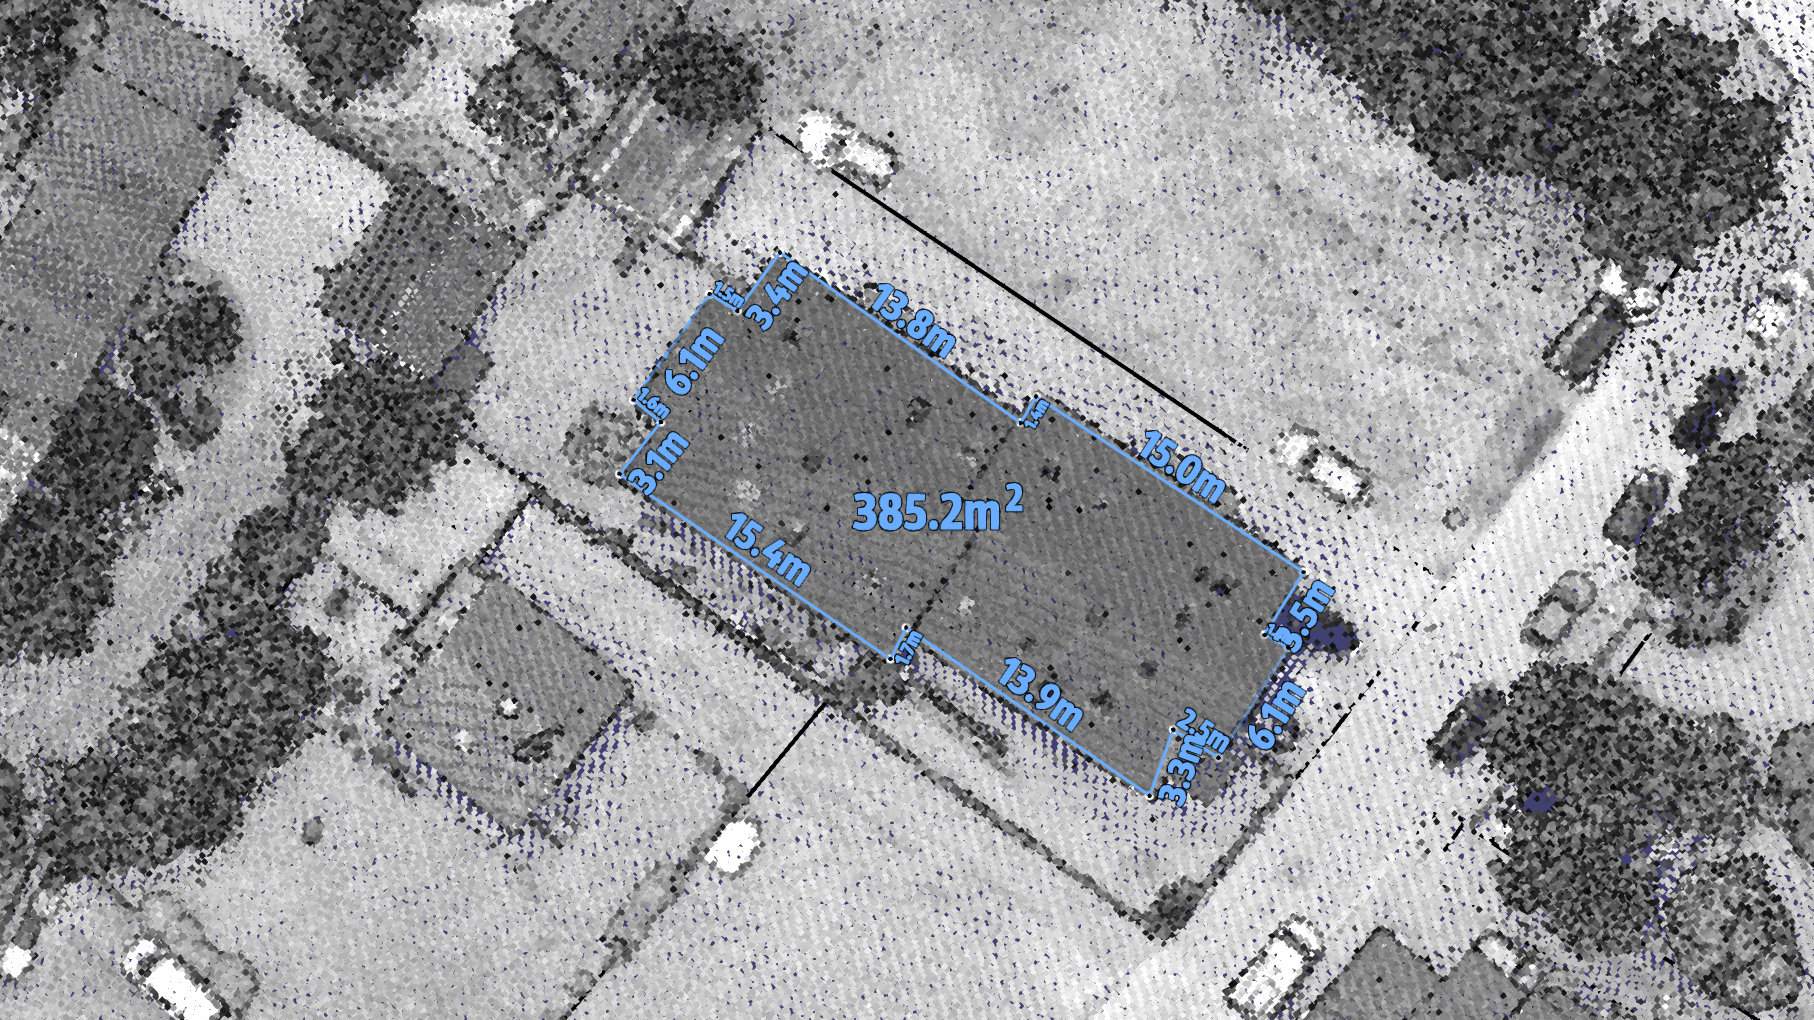
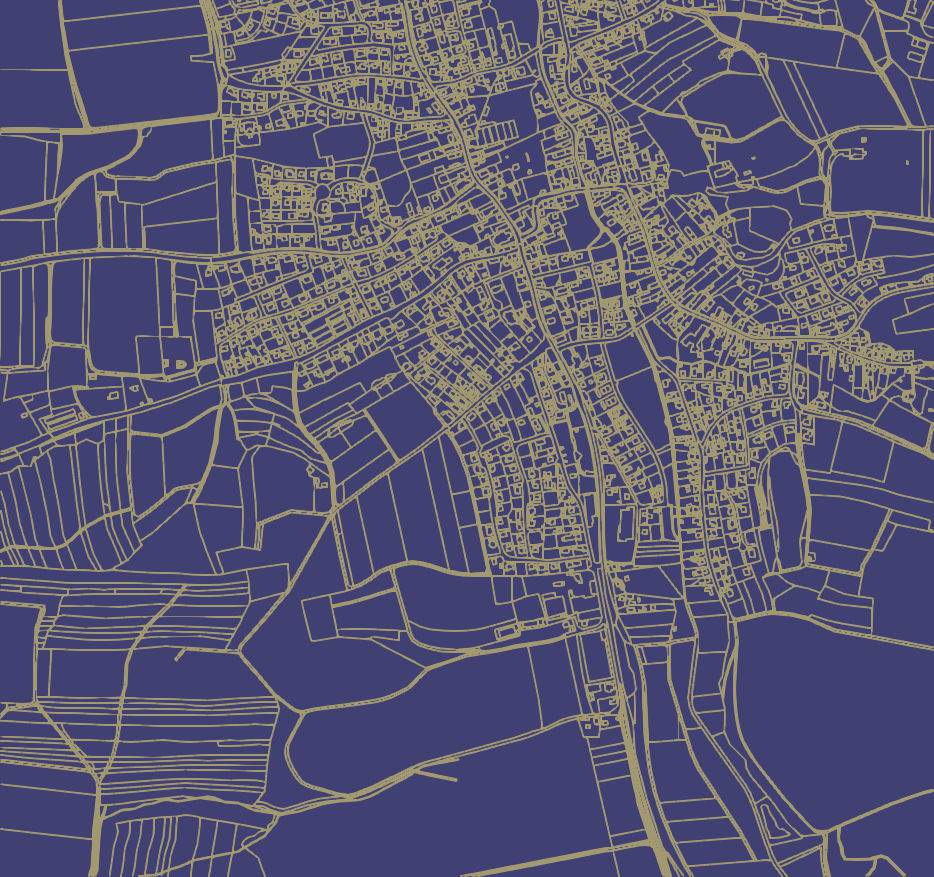
Shaded surface of cadaster data via level-of-detail.
Point Clouds of Laser Scans

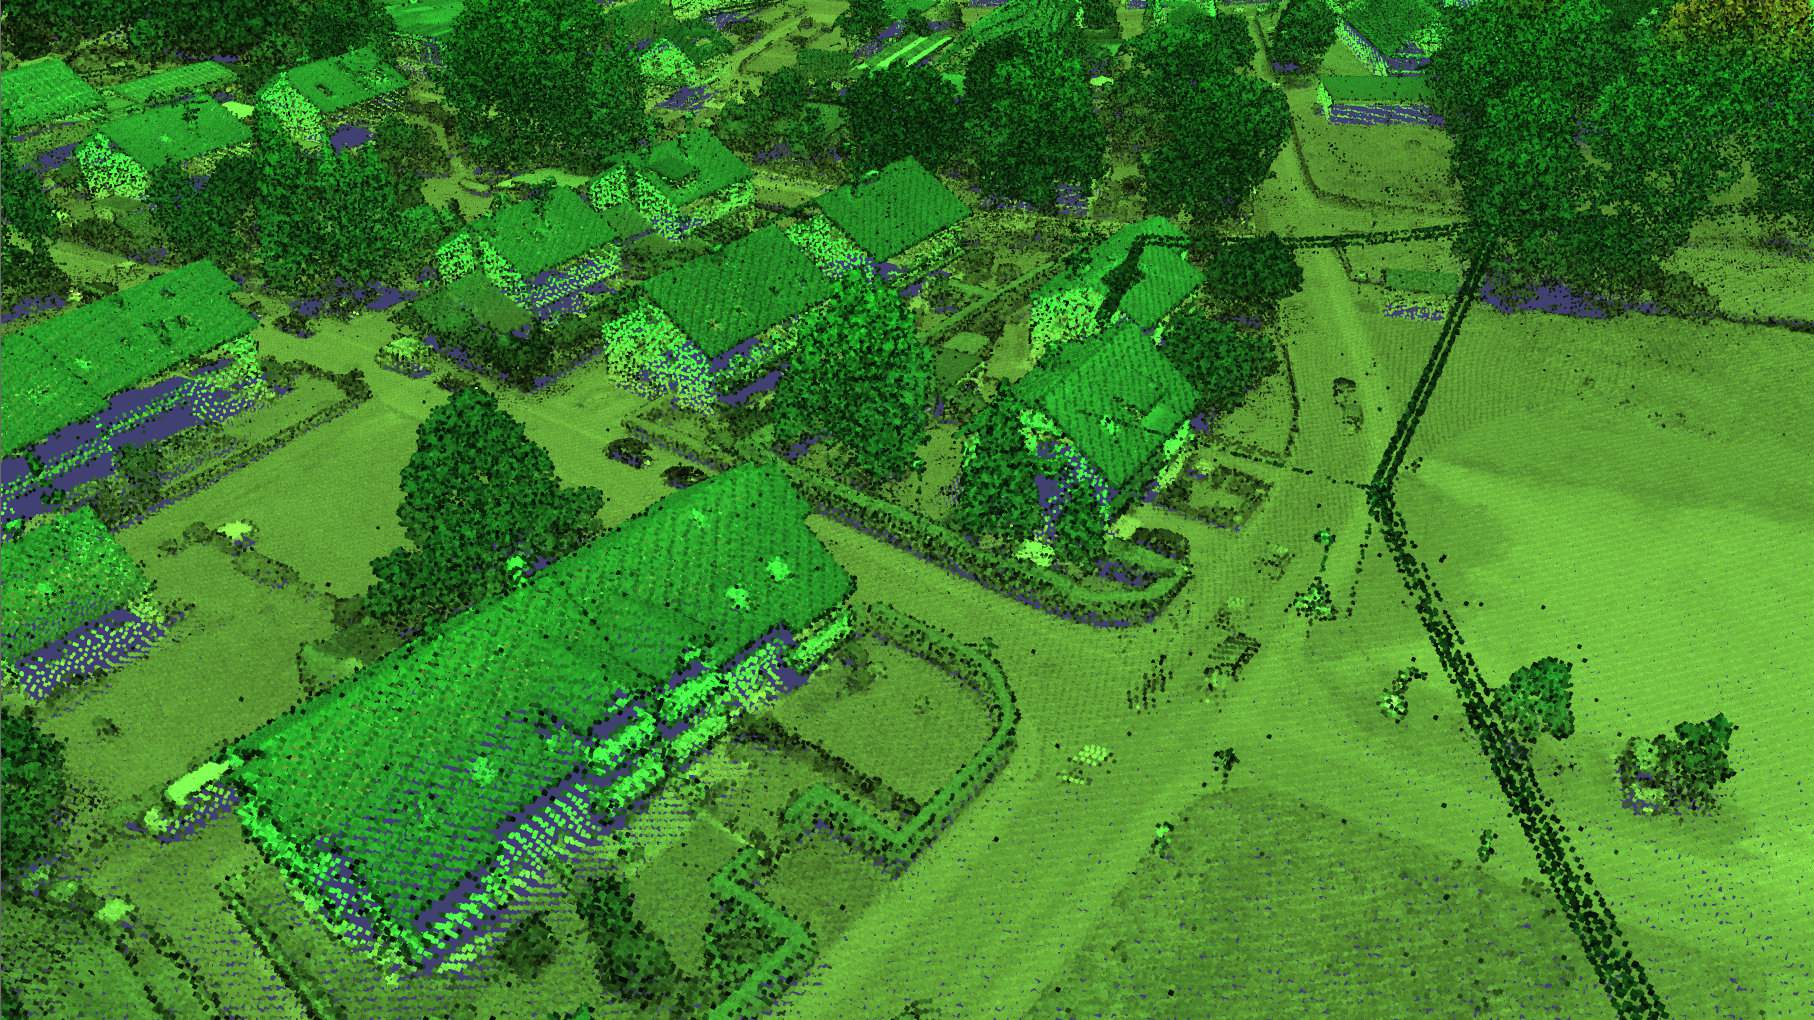
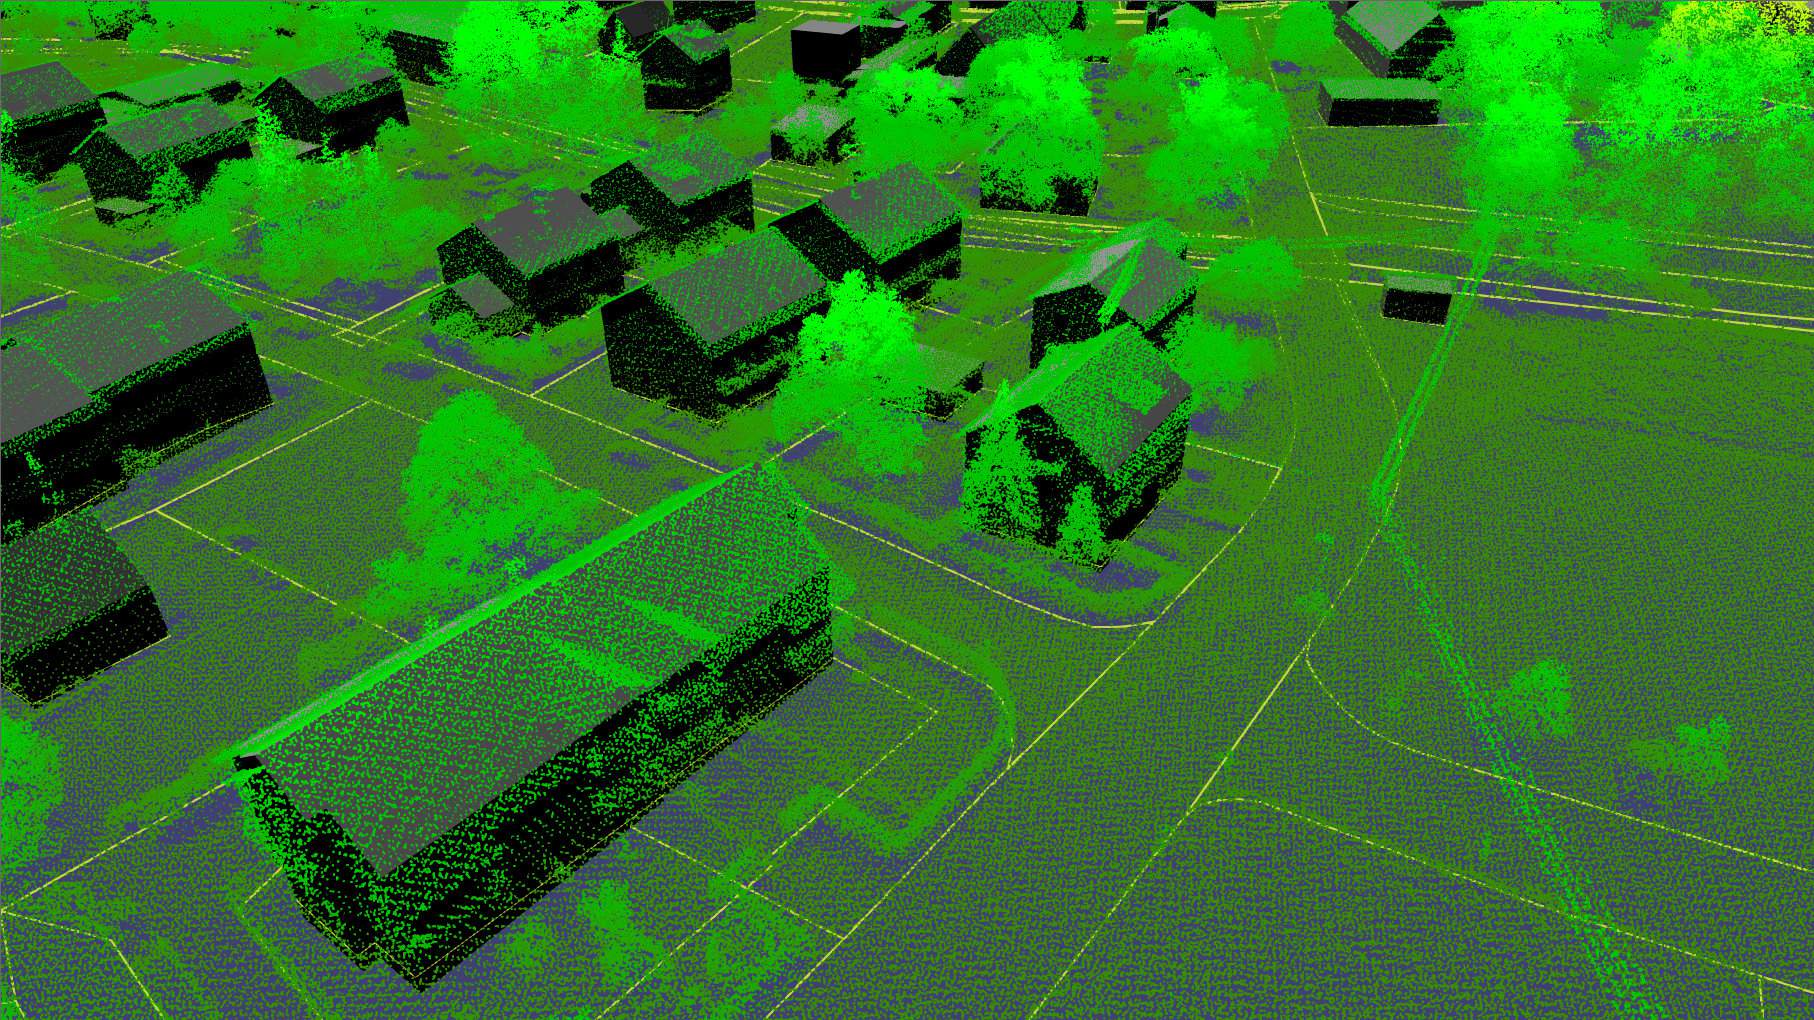
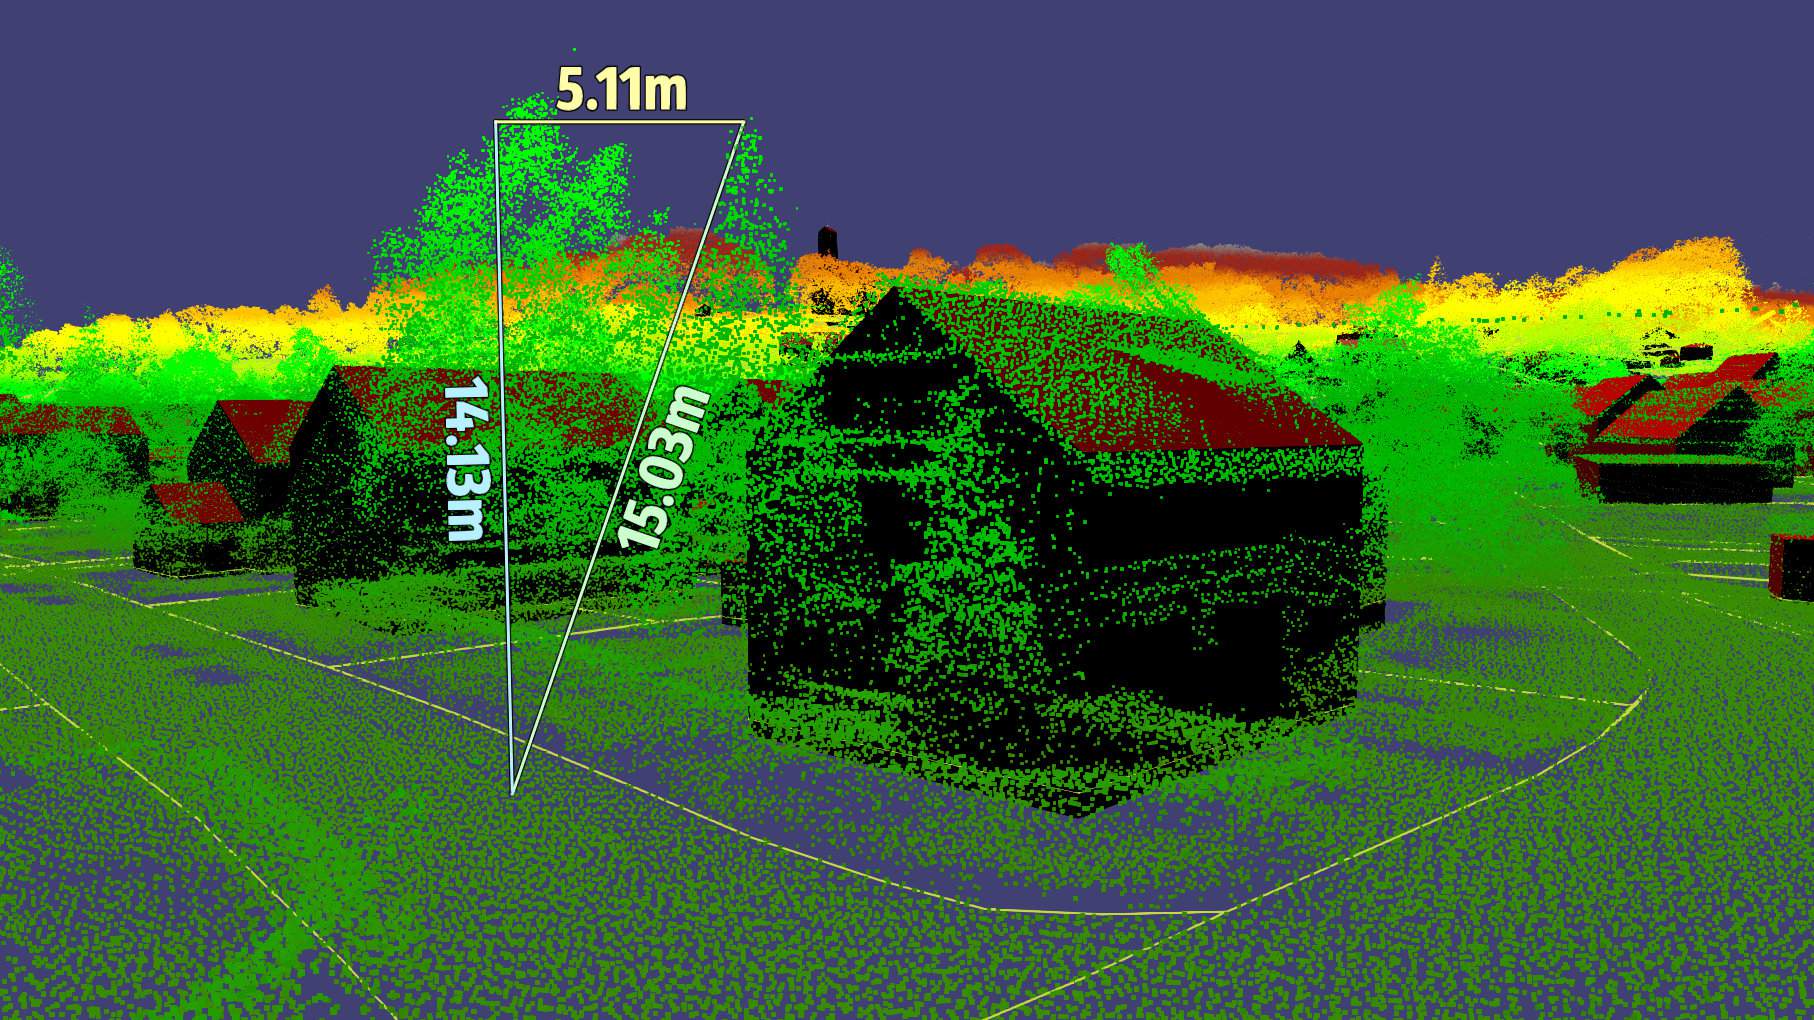
Color coded LiDAR echoes illustrated by small geometry elements.
Aerial Images

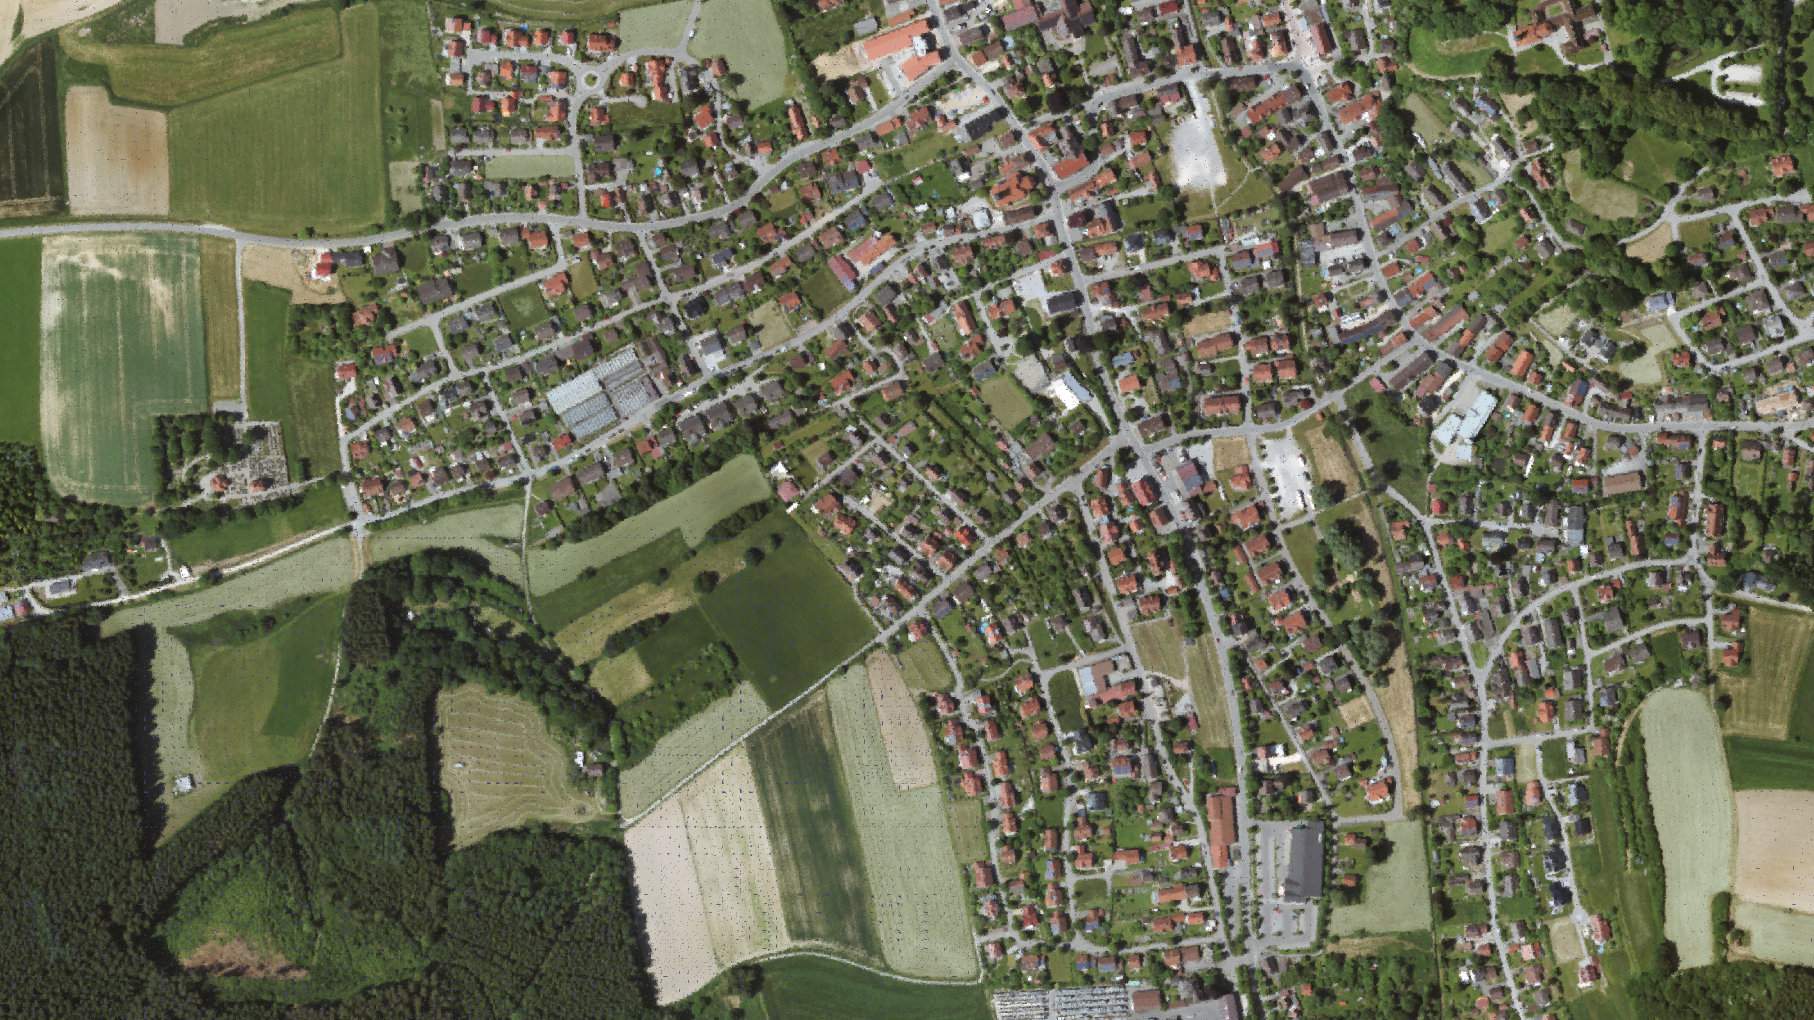
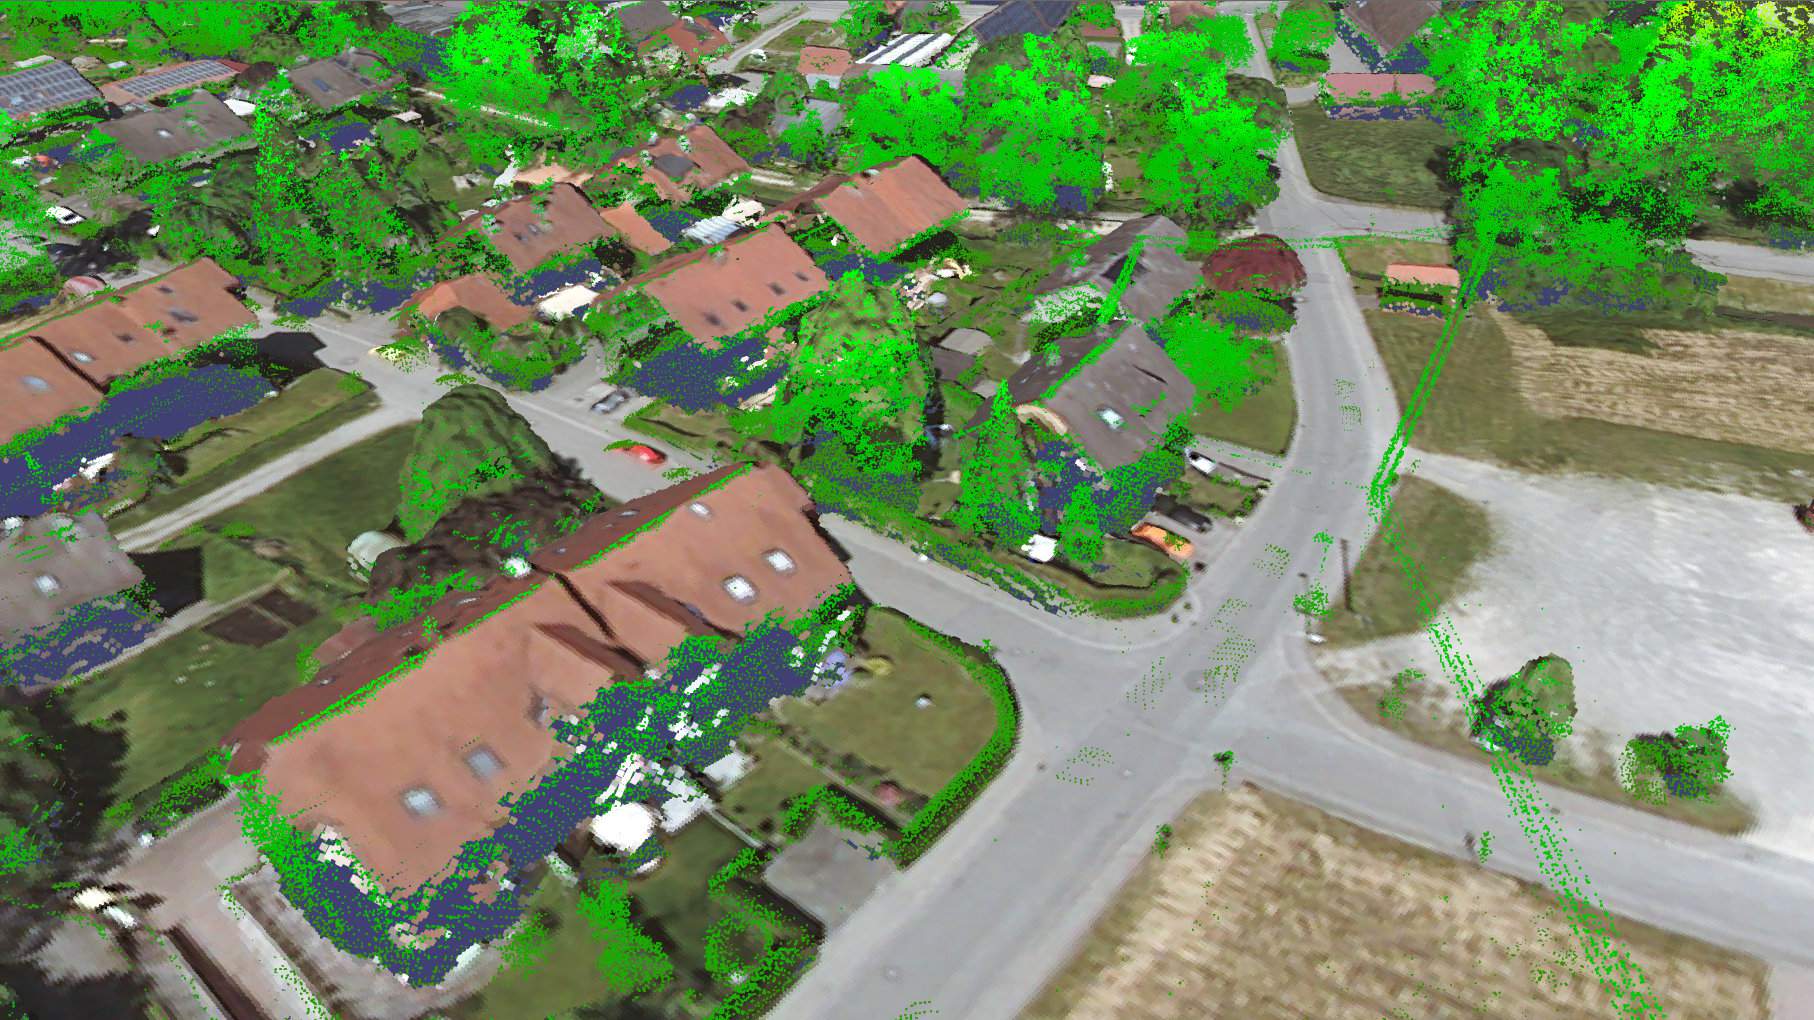
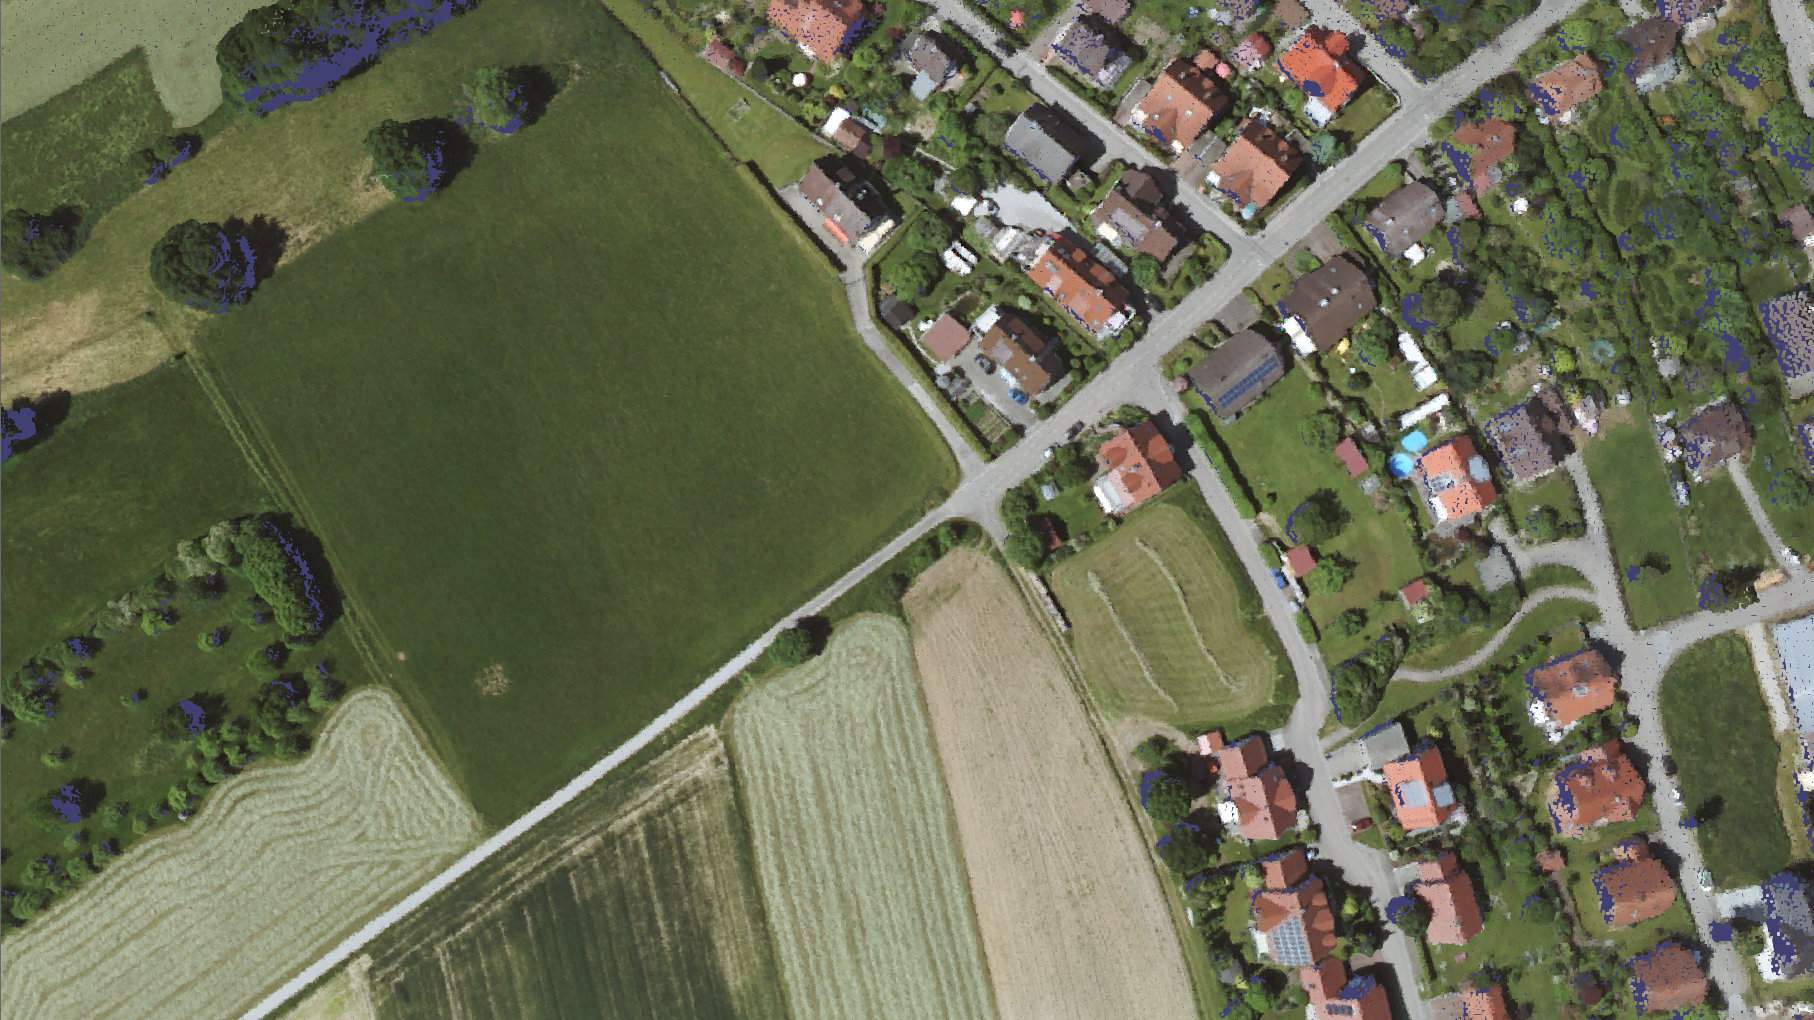
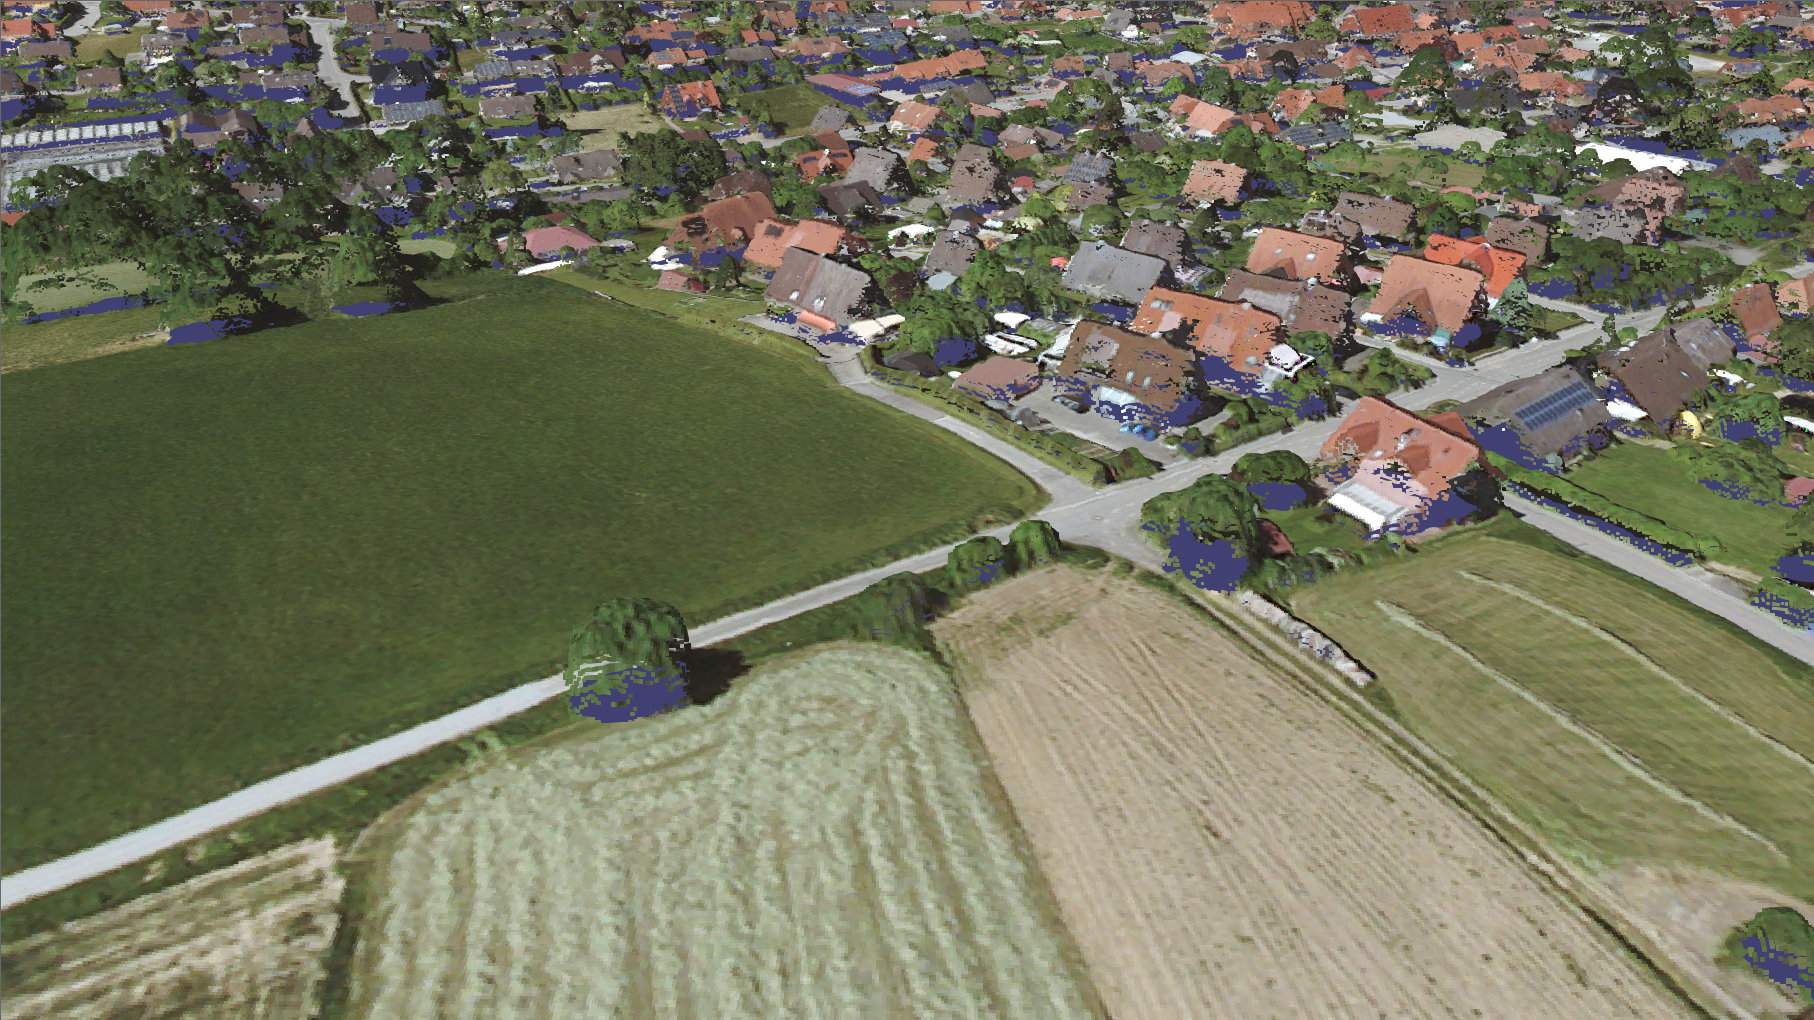
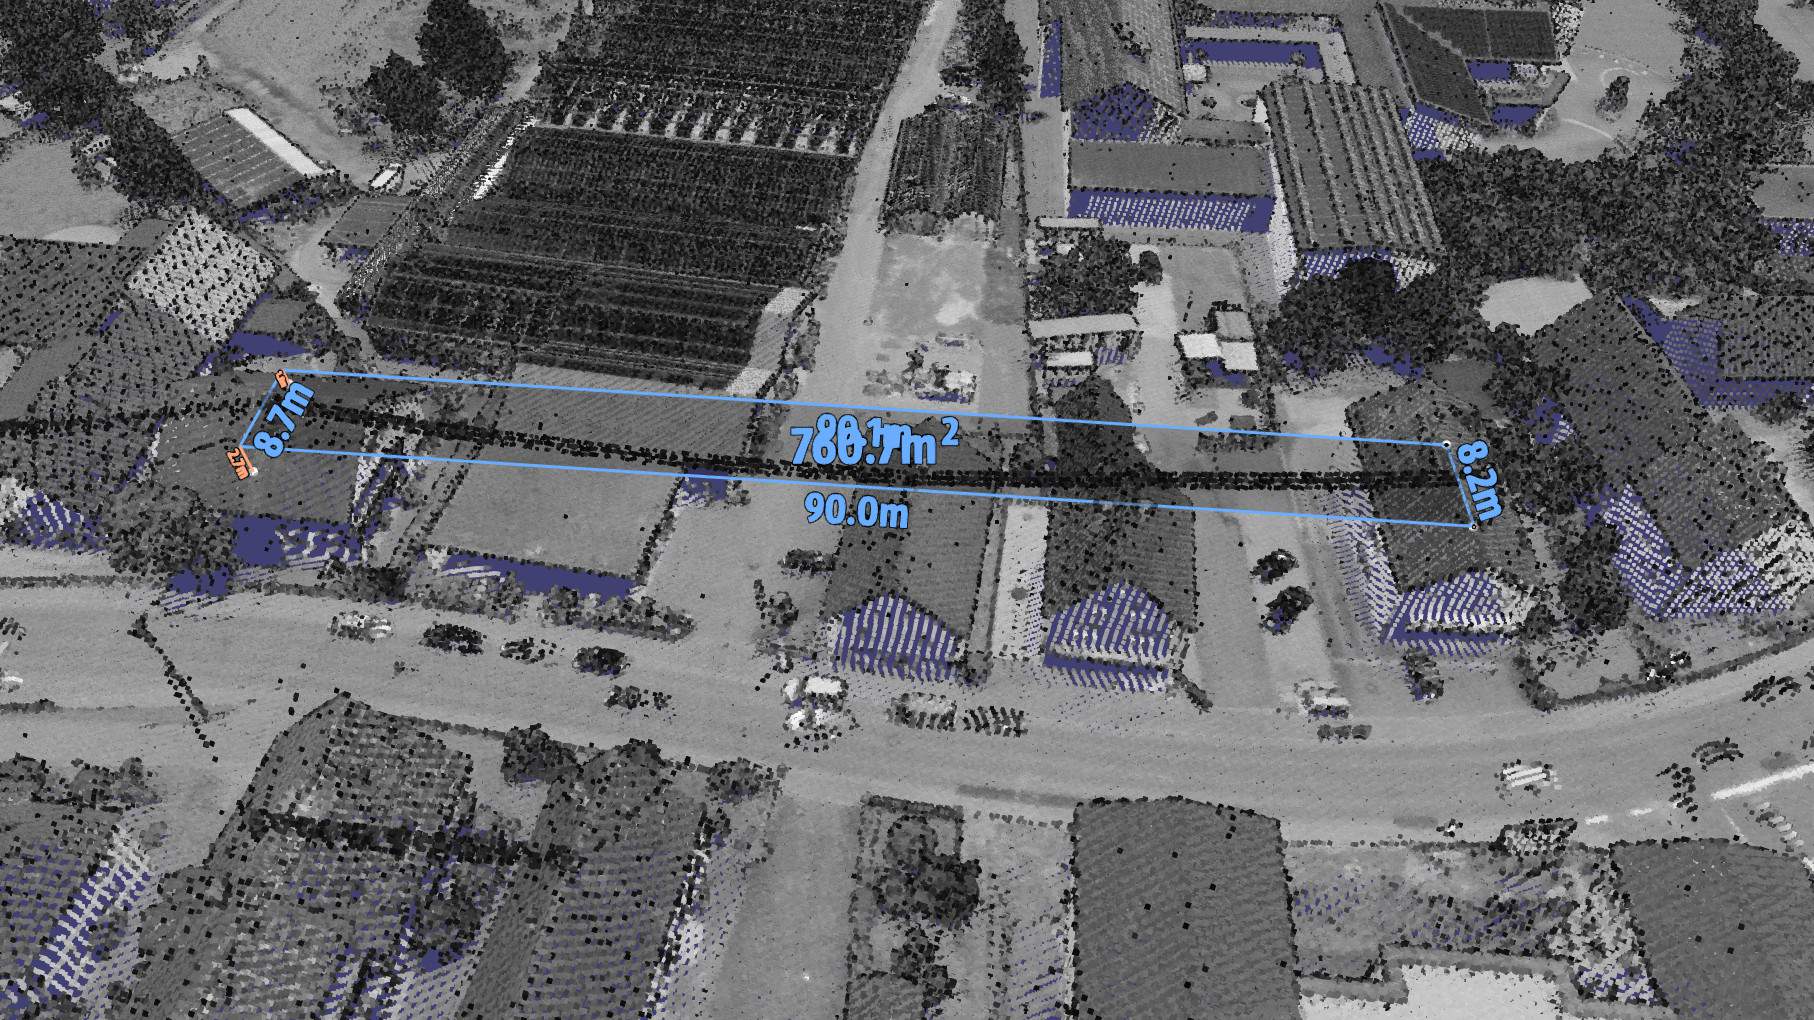
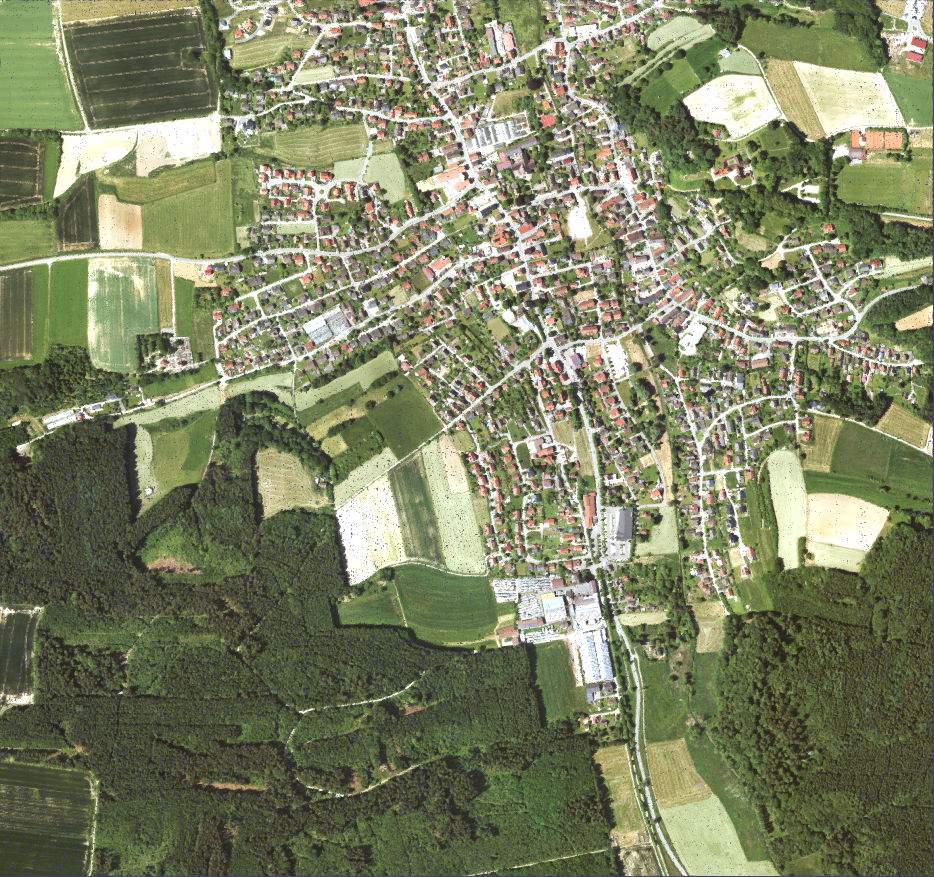
Colored point clouds by aerial images.
Line and Area Measurements

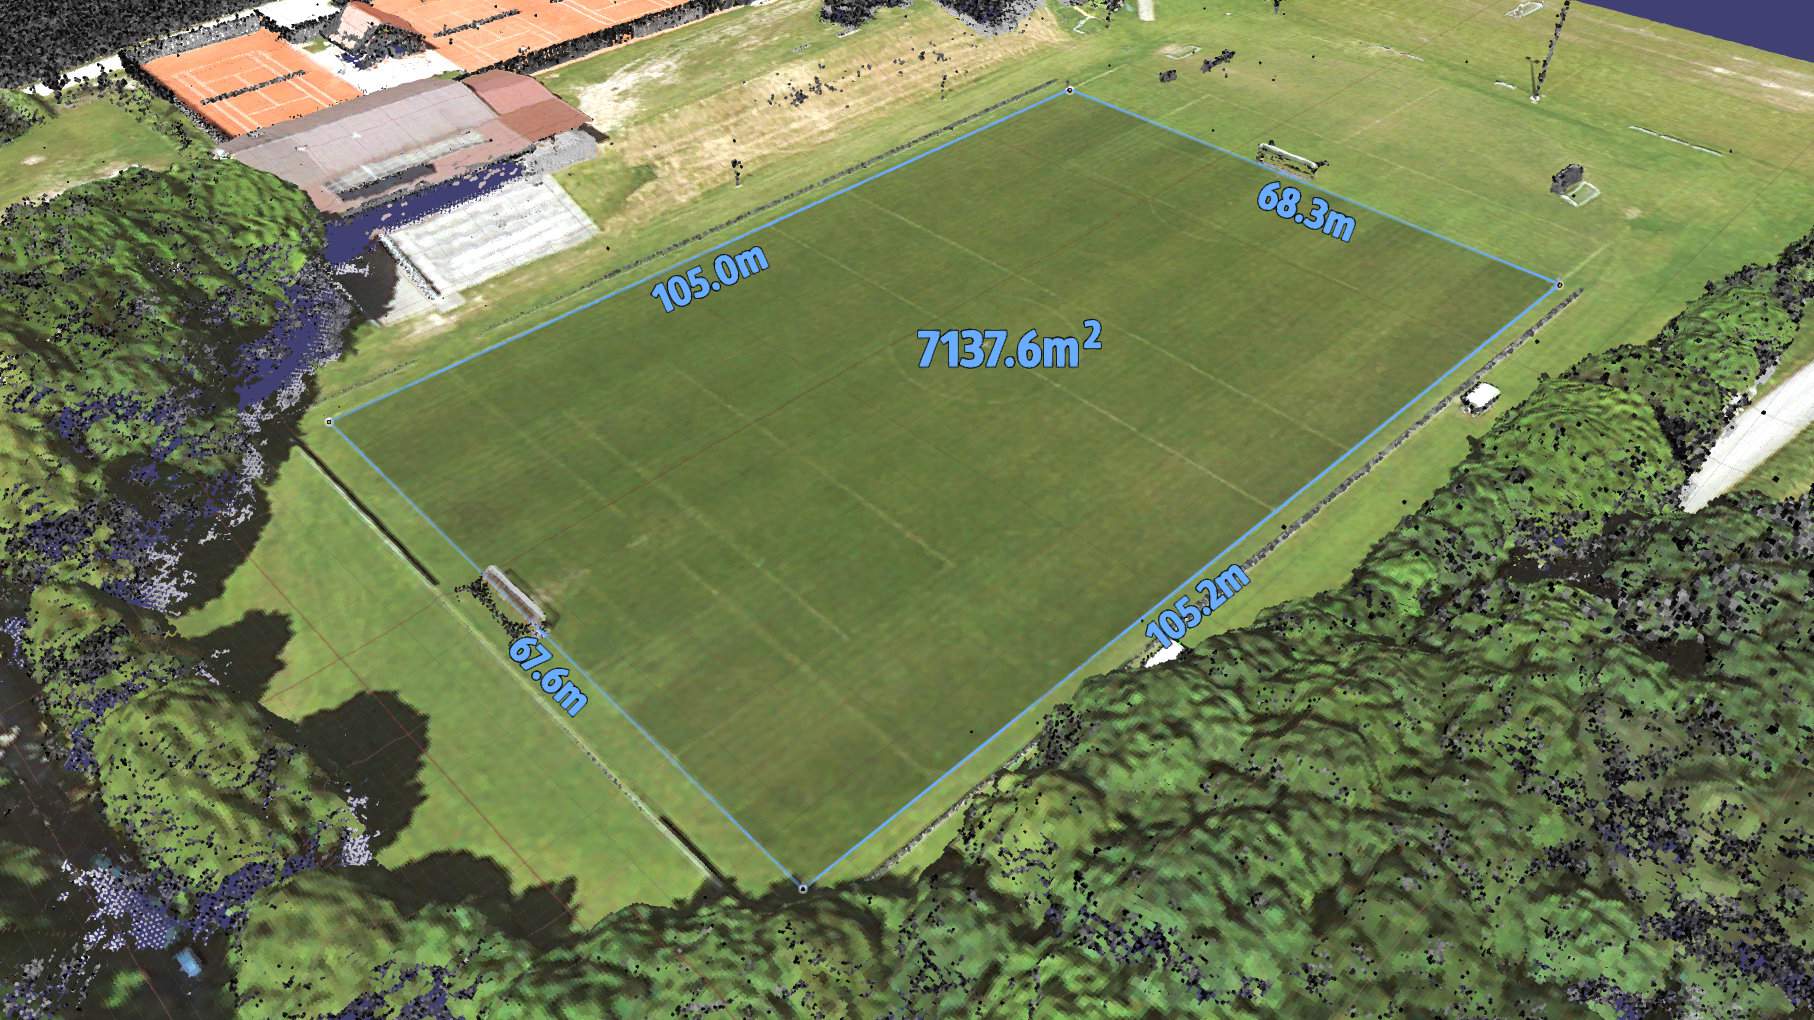
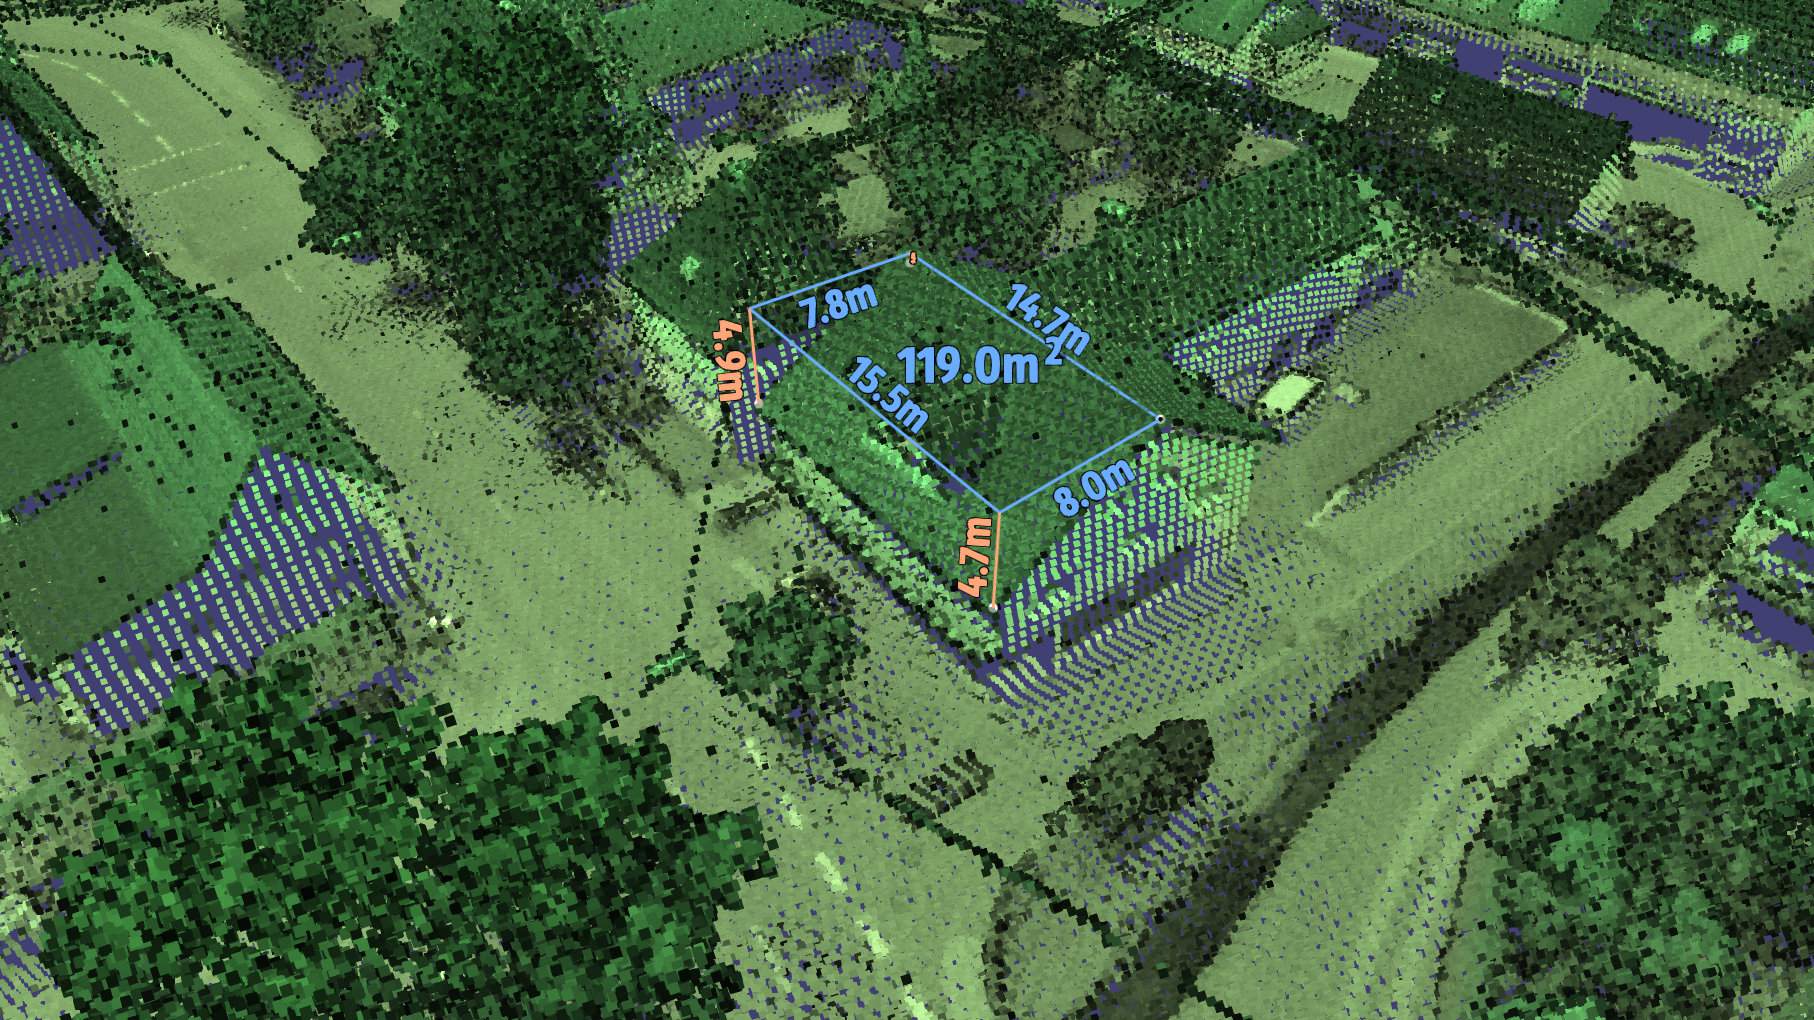
Distance and area measurements on all visible geometries.
Transfer of Polygons and Data Export

Polygon creation and transfer to and from GIS. Mass data export inside defined polygons.

Interactive features ease the workflow with big data.

Download and Order


System Requirements:

  • PC running Windows version 7 or higher.
  • 300MB storage for KomVISH
  • 16GB RAM
  • NVIDIA GPU, 970-GTX or higher
  • 5.5GB storage for the data-demo, SSD recommended

    Note: The visualization in KomVISH is not limited
    by data size. Dependent of the project size a SSD
    disk or a raid-system ≥ 500GB is recommended.

Data-Demo:

The data-demo shows a small communal. Explore the data coupled with the GIS systems Kominfo and ArcGIS, or via the stand-alone application. Data is downloaded by the KomVISH installer.
Following data sets are combined:
  • Digital terrain model (DTM), 5m resolution
  • Cadastral map including height information
  • Digital surface model (DSM), 20cm resolution, colored by aerial images
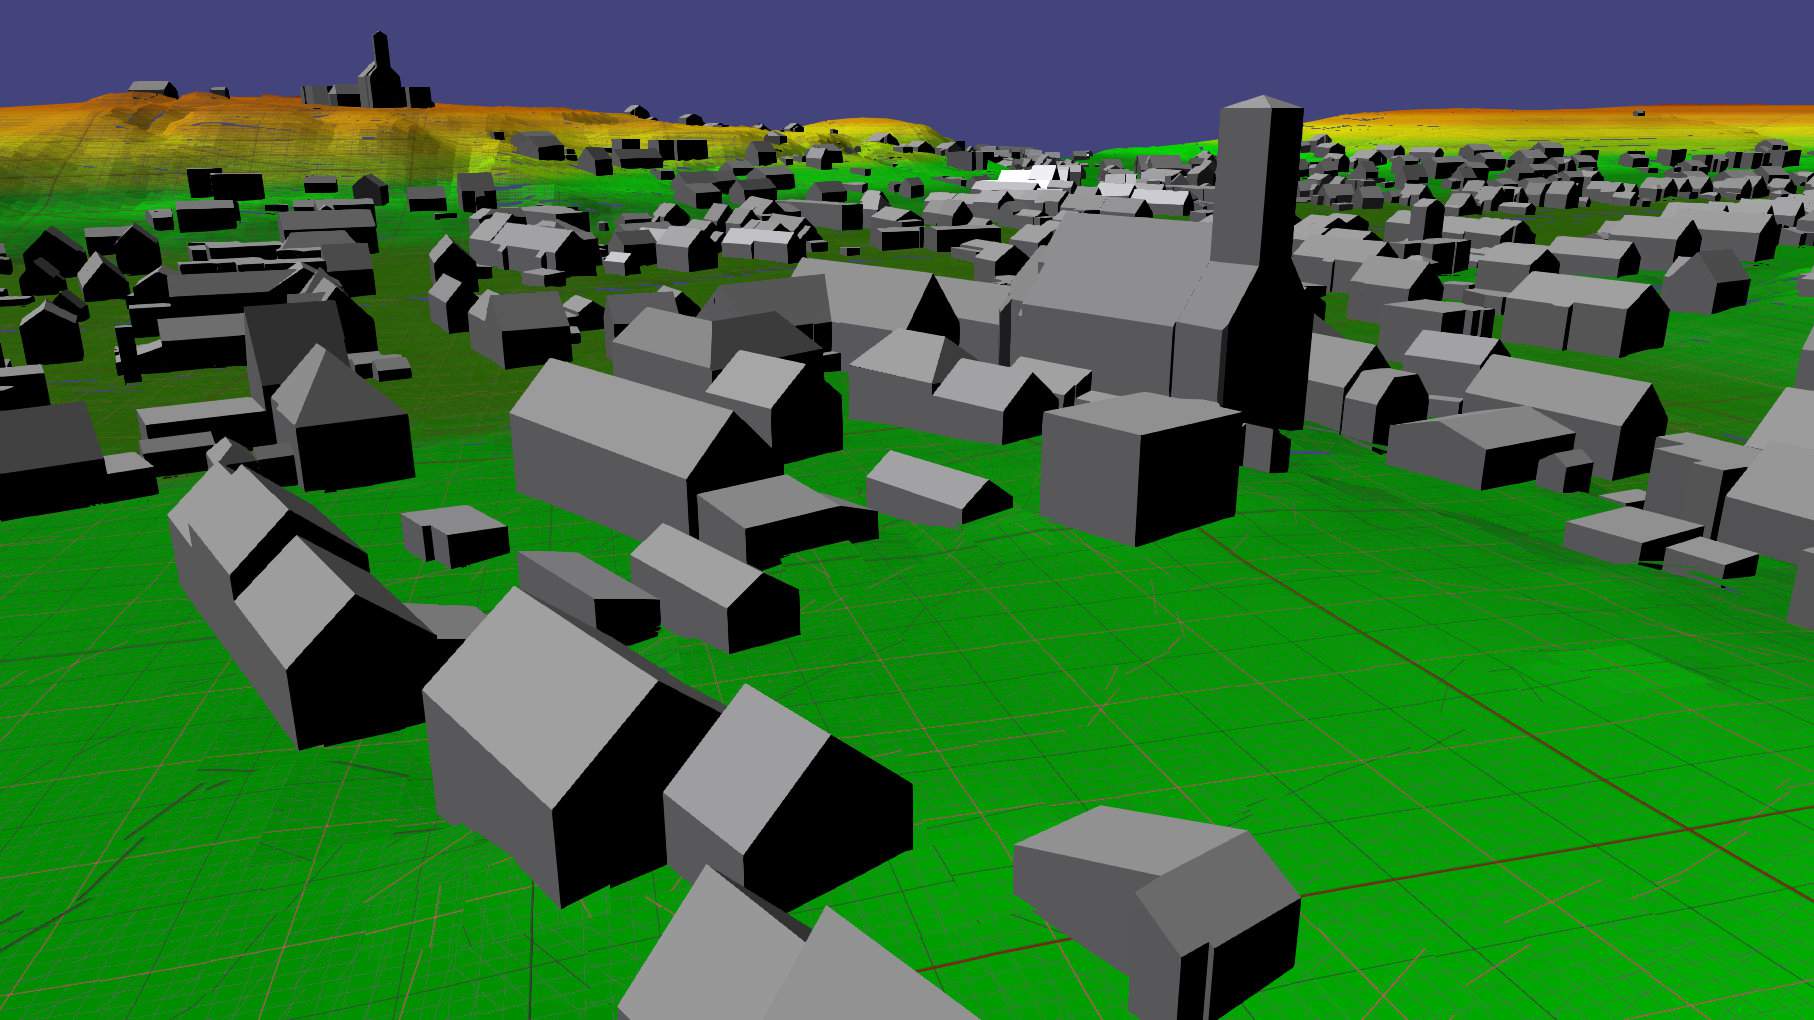
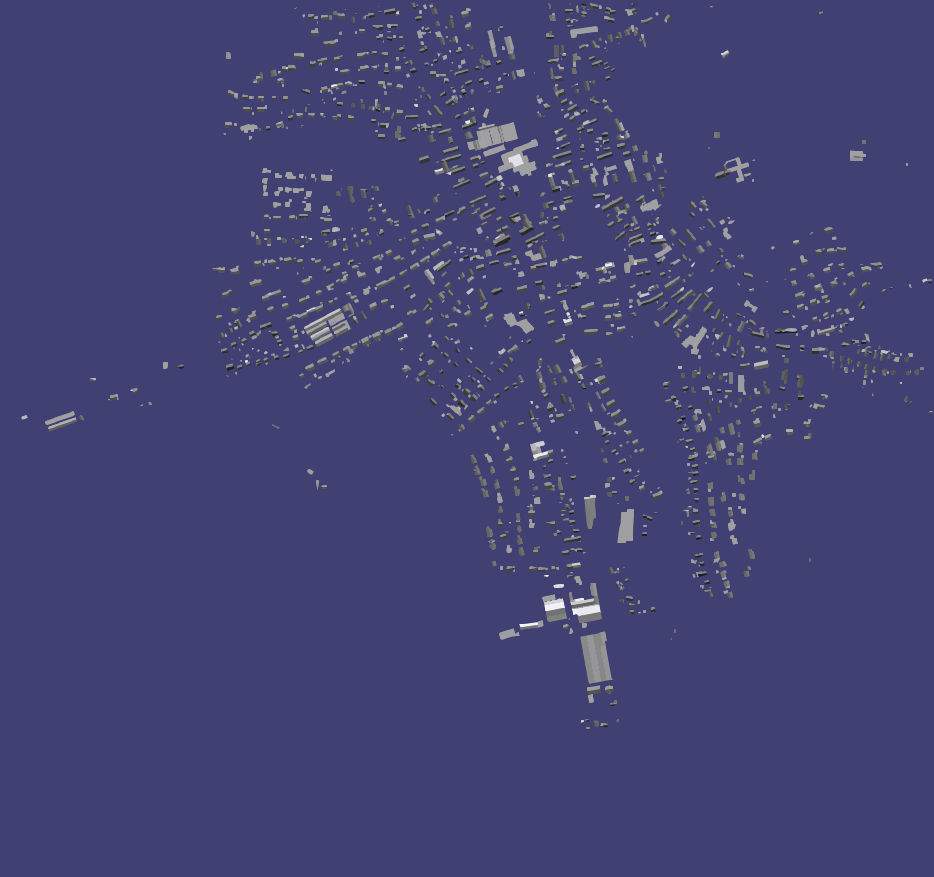
  • Level-of-detail buildings
  • Measurements of a terrestrial survey
  • High resolution point cloud of airborne LiDAR, 5-10cm resolution


Old Versions


Visit us        

Impress    Disclaimer / Copyright    Data Privacy / Security    Hyper-Links

2018 AirborneHydroMapping GmbH
  Digital Elevation Models

test1

Digital elevation models are illustrated by oriented rectangles. Visually this forms closed and shaded surfaces resulting in a seizable 3D representation of a DTM or DSM. Surfaces are colored by height. Additionally, marker lines can be faded in to either represent contour lines or a horizontal grid. Thus, height information can be read like from a standard map.
  Level-of-Detail Data

Cadaster data as lines with height information (3D lines) and buildings as LOD data displayed by shaded surfaces.

Level-of-Detail or LOD Data are illustrated as triangulated Objects. They are shown as shaded surfaces in a user defined color. Alternatively, a wireframe representation can be enabled.
  Point Clouds of Laser Scans

High resolution LiDAR point cloud colored by reflectivity and height.

Point clouds are represented by small geometry elements and are colored by height, a data-field (e.g. reflectance), or a combination of both, and shaded. The number of points to be illustrated is unlimited and visible parts of the data set are loaded and provided most efficiently by the data layer. The border of the points can be darkened to gain a better contrast for single points or kept flat to visually mix into a surface representation.
  Aerial Images

Topdown view on aerial images mapped onto the digital surface model in parallel projection - map-like view.

Aerial Images are shown either directly on the measurement points, or below the DEM as in the 3D space placed images.
  Line and Area Measurements

Area and distance measurement by the interactive polygon on combined data of ditigal surface model and LiDAR point cloud.

A line or polygon can be created using an interactive measurement tool. Every visible geometry is a valid a target for the measurement. Additionally, a snapping can be activated to snap to the exact data points. Besides distances, also relative heights, horizontal distances and areas can be evaluated, as well as angles and total length.
  Transfer of Polygons and Data Export

Measurement polygon on a high resolution LiDAR point cloud colored by reflectance.

One or more measure polygons are sent by one click directly to the instance of an open GIS application. Thus, polygons can easily be created directly on the data-points and added to, modified, and enriched by the GIS system.
Data points, such as high resolution LiDAR data, can be exported from polygonal regions as ASCII tables (CSV), LAZ files, or as F5 (HDF5) files.
  Impress

Created by AirborneHydroMapping GmbH, Innsbruck 22.5.2018

AirborneHydroMapping GmbH (AHM)
Commercial register: FN 398330f
Place of jurisdiction: Landesgericht Innsbruck, Austria
VAT: ATU68023569

CEO:
ZT Dipl.-Ing. Frank Stefan Steinbacher | Prof. Dr.-Ing. Markus Aufleger

Feldstraße 1b
A-6020 Innsbruck

+43 (0)512 - 319070
info@ahm.co.at
ahm.co.at
  Disclaimer / Copyright

Despite careful control we assume no liability for the content of external links. For the content of linked pages their operators are mandatory.
Use of website:
The texts, images, material and other content contained on this website are provided for general information purposes only. AHM assumes no responsibility or liability what so ever regarding the correctness, appropriateness, completeness, up-to-dateness, and quality of such content and for the accuracy of the depicted objects respectively. Any and all liability for any kind of damage, regardless whether material or immaterial and regardless of its legal basis, which occurs through the use of this website or the information displayed thereon, is excluded.
Copyright and Related Rights:
The texts, photographs and other images contained on this website are protected by Austrian copyright laws. Copying, editing, processing, and any other utilization beyond this laws require a written confirmation of the respective creator. Downloading and copying are allowed for private and non-commercial use, only.
We reserve the right to modify, supplement partly or entirely, delete the content of this website at any time. We do not assume any responsibility or liability for any consequences thereof.
  Data privacy / security

The here shown images derived from surveying data and aerial images. They have been anonymized by blackening the cadastral numbers and coordinates. Generally, you have the following rights according to the General Data Protection Regulation (GDPR):
Access, Article 15 GDPR
Rectification, Article 16 GDPR
Erasure , Article 17 GDPR
Restriction of processing, Article 18 GDPR
Data portability, Article 20 GDPR
Object, Article 21 GDPR
Automated individual decision-making, including profiling, Article 22 GDPR

Responsible for personal data:
AirborneHydroMapping GmbH, Feldstrasse 1b, A-6020 Innsbruck

Responsible for the data map and
contact for questions and requests:

Dr. Werner Benger
Dr. Ramona Baran (substitute)
info@ahm.co.at
  Hyperlinks

Links to external websites ("Hyperlinks") are provided as a convenience to our users. These websites are entirely independent from and outside the control of AHM. We make no representation what so ever about any content of any external websites which link to this site or which are linked from it and accept no liability for the content, correctness or legal conformity of such websites.
  Old Versions

KomVishInstaller-10Oct2017.exe
KomVishInstaller-27Jul2017.exe
KomVishInstaller-26Jul2017.exe
KomVishInstaller-26Jun2017.exe
KomVishInstaller-19Jun2017.exe
KomVishInstaller-13Jun2017.exe
KomVishInstaller-24May2017.exe
KomVishInstaller-11May2017.exe
KomVishInstaller-08May2017.exe
KomVishInstaller-05May2017.exe
KomVishInstaller-24Mai2018.exe